2 General Operating Information
46 Keysight 2050/60 X-Series User’s Guide
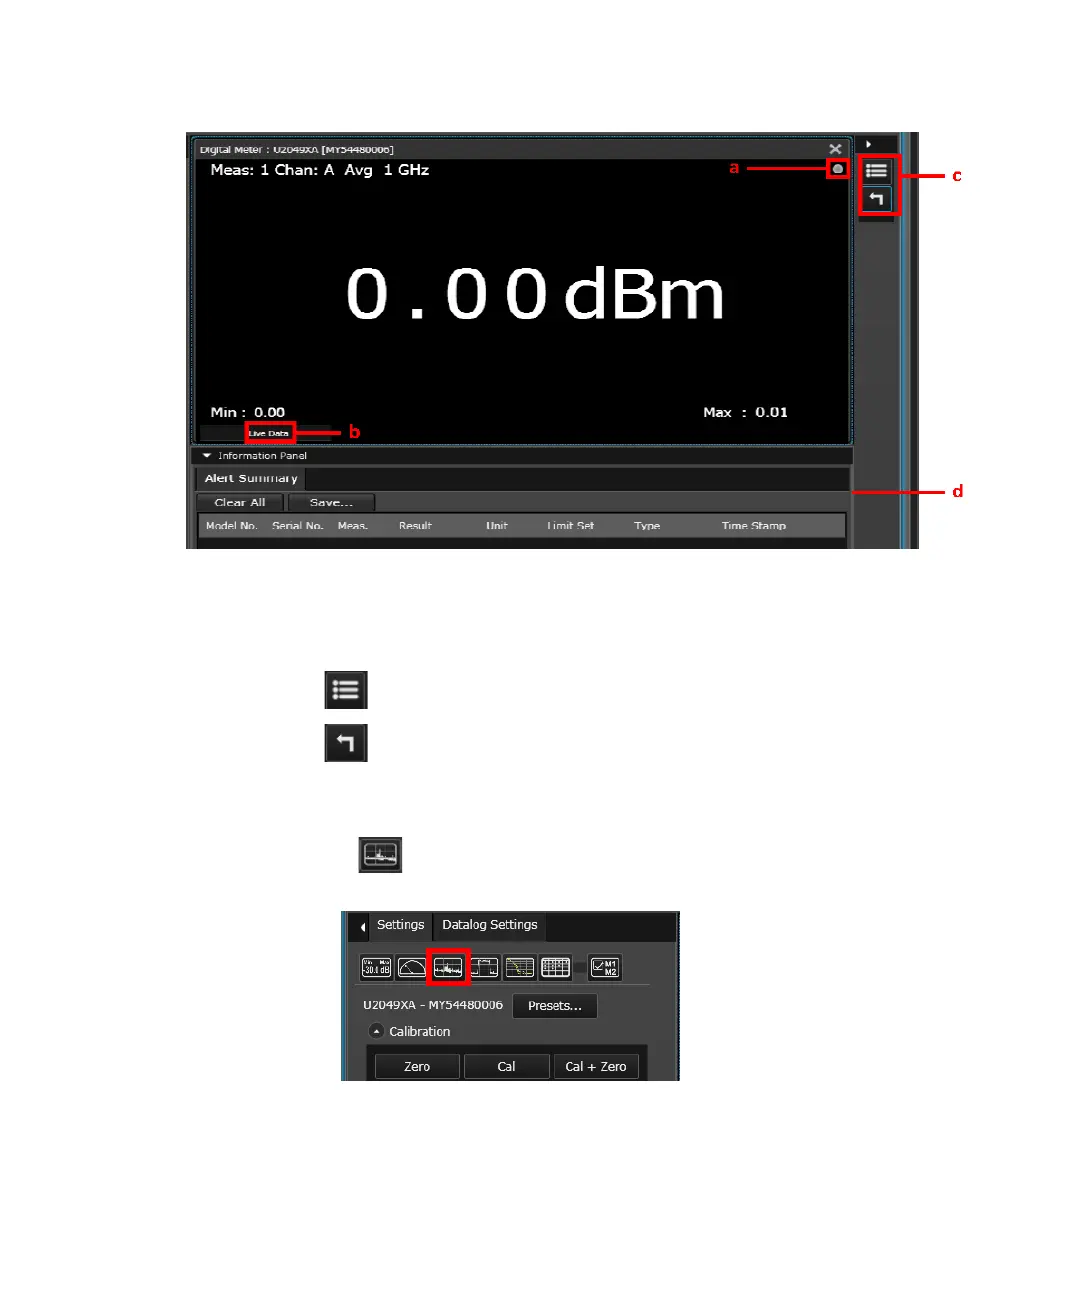
5 You should be able to view the average power measurement results in the Digital Meter
display view.
Figure 2-5 Average power meter measurement results
a Indicates acquisition of measurements in the Run mode
b Indicates the measurement status
c Change the title at the top of the display view
Reset the displayed Minimum/Maximum measured values
d Summary of alert limit conditions for the current measurement
6 To monitor the average power over a period of time, create a Datalog display view by
clicking .
Figure 2-6 Creating Datalog display view
Select one of the available measurements from the list and click Ok.

 Loading...