KIC 2000 v2.4.0.x
KIC 2000 User Manual 63
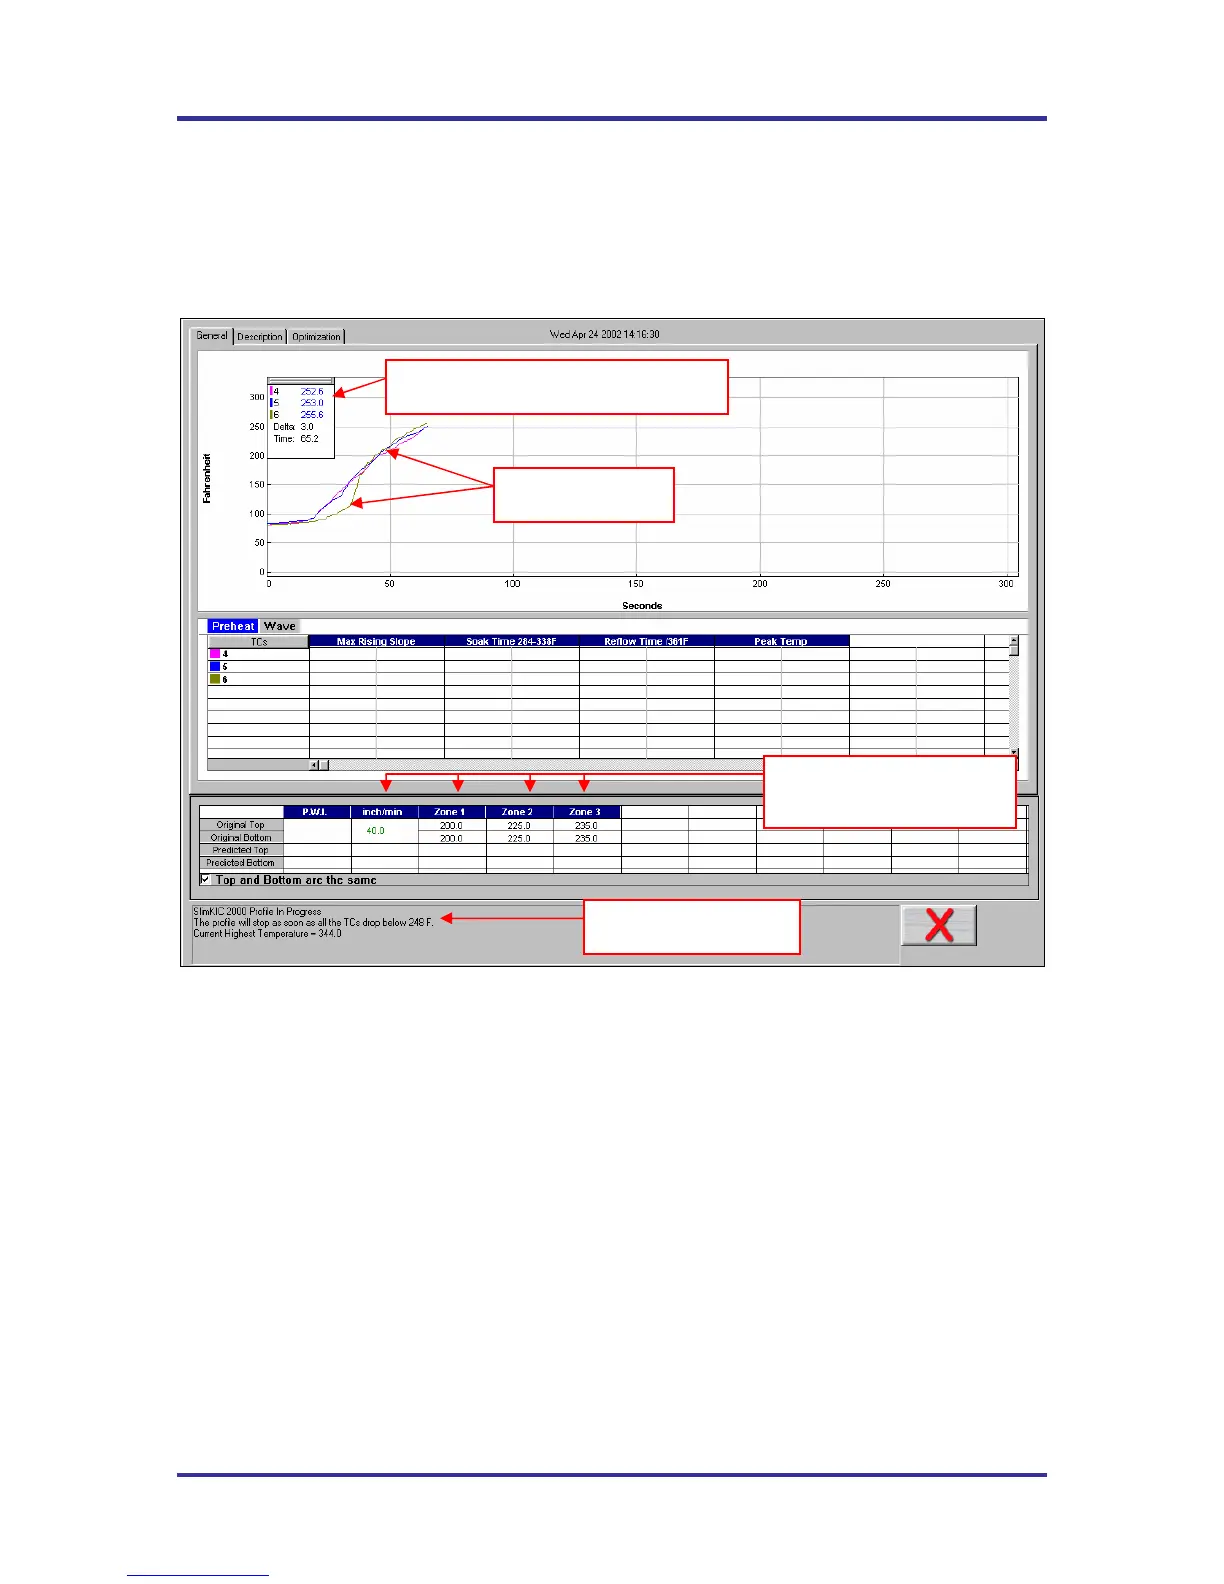
Live Profile Graph Display
The live profile graph display is displayed only when using the SlimKIC 2000 or KIC Explorer RF models.
The live profile graph display will show the profile plot on the graph for the current profile that is running.
See Figure 100.
If you have a SlimKIC 2000 or KIC Explorer-Data log model, you will not see a live profile display.
Figure 100: Live Profile Graph Display
While the KIC Profiler is in the oven, and until the profile has ended, the software will continue to display
the live profile graph. The other tabs at the top of the screen; Description, and Optimization are
inaccessible. See Figure 100.
• The live profile is plotted on the graph.
• The current temperatures for each thermocouple and the Delta between them are displayed in a
small window in the upper-Left hand corner of the profile graph. The elapsed time is also
displayed.
• The current oven temperature set points and conveyor speed for this profile is displayed beneath
the Statistics table.
• The profile status is continually updated throughout the profile. SlimKIC 2000 and KIC Explorer
RF models only.
The Live profile graph display will remain on your screen until the KIC Profiler has achieved the trigger
temperature that determines the profile end.
Temperature plots
Oven temperature settings
and conveyor speed.
Live profile status
Live temperature readings and Delta