Status
E220 Series Cellular Router User Guide 41
Traffic
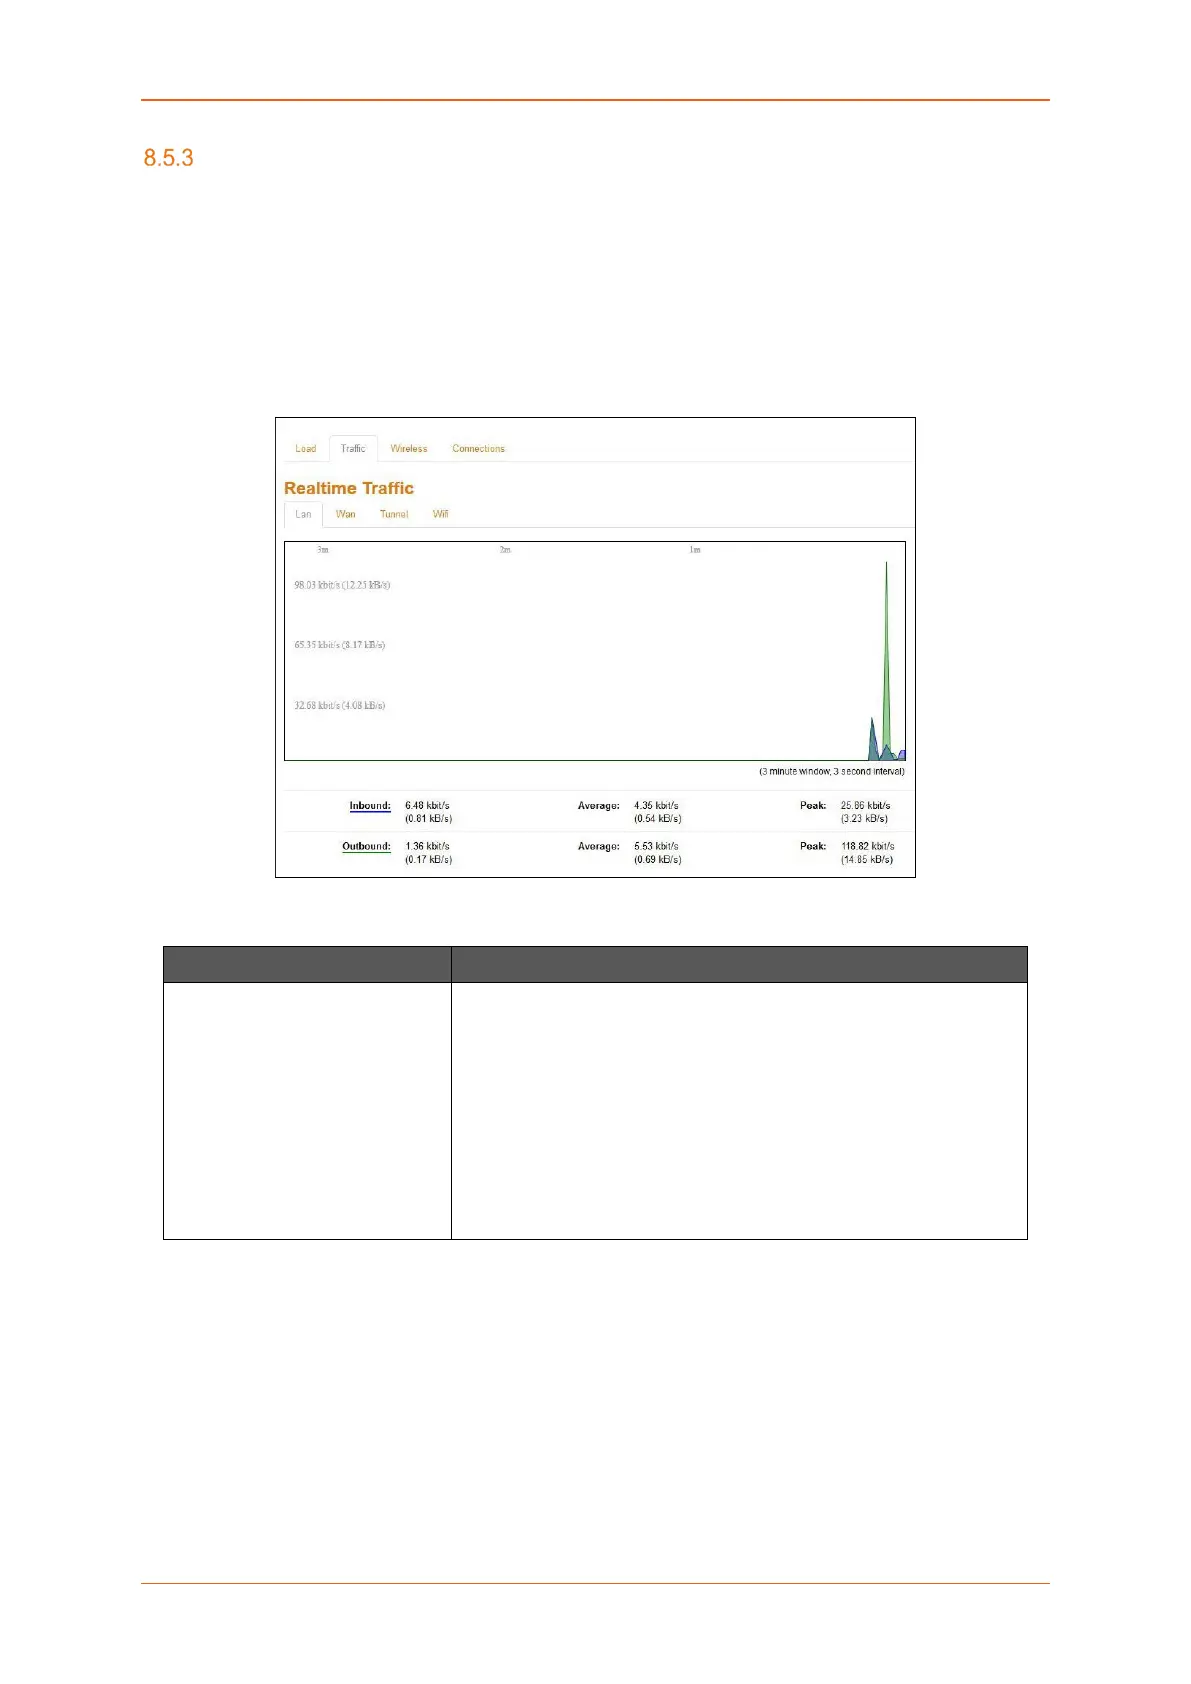
Status > Realtime Graphs > Traffic
Traffic indicates the WAN side incoming and outgoing traffic. Traffic Graphs displays combined graph
of Upload and Download data transfer. Colors differentiate upload and download data traffic. In addition,
shows the average and peak data transfer for upload and download individually.
A. LAN
Graph shows past three minutes average LAN traffic and peak LAN traffic on the router.
Screen 8-5: Real Time LAN Traffic Graph
Parameters Description
Traffic (Inbound / Outbound) Graph shows the periodic average LAN Traffic on the Router.
Details
• X axis – Time Interval (1 minute)
• Y axis – LAN Traffic (kB/s)
Legends
• Blue – Inbound Traffic
• Green – Outbound Traffic
Table 8.5-3: Real Time LAN Traffic Graph
 Loading...