Alarm Status
This shows at a glance if the UTRID-16 recorded alarm conditions
during the trip (showing a red
) or if no alarms were recorded
(green
).
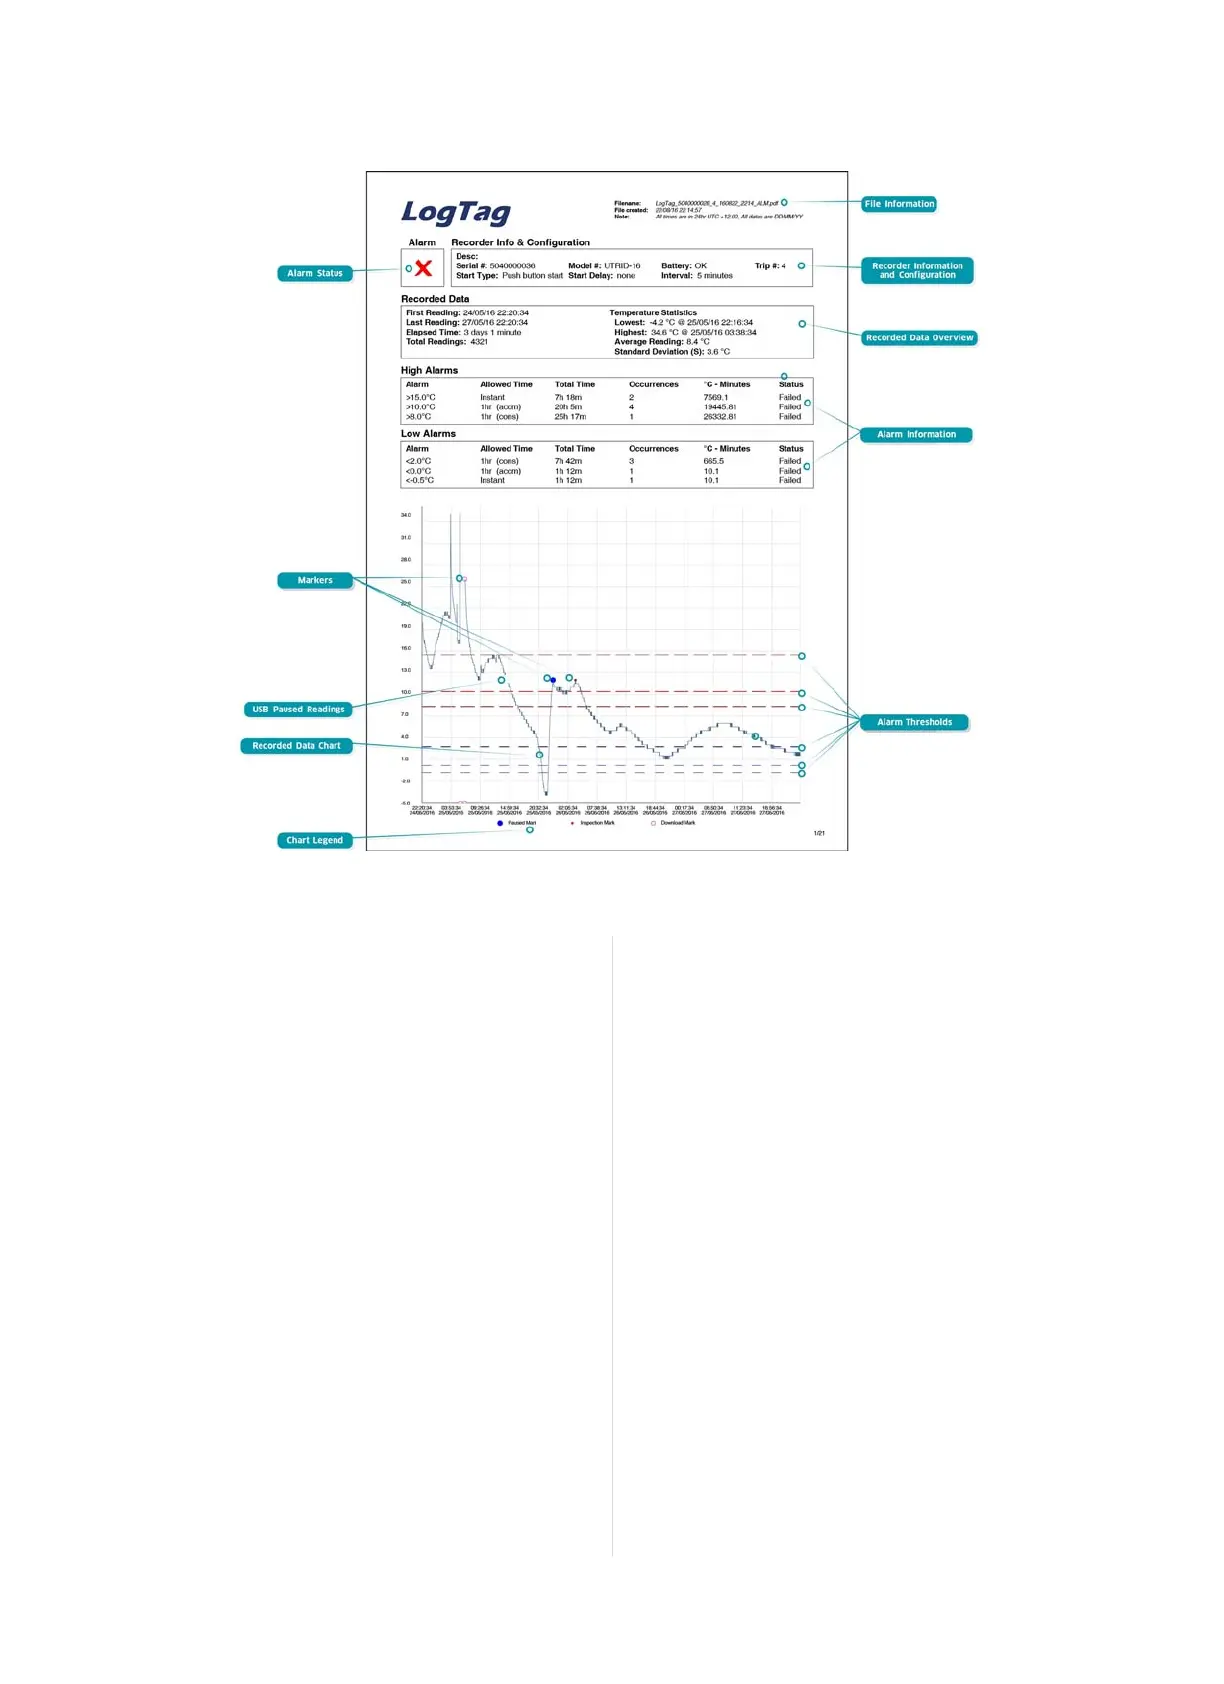
File Information
This section shows general information about the PDF file, such as
generation time, date and time formats and the file name, which is
compiled from information about the data it contains:
LogTag_[serial_number]_[trip number]_[file creation date]_file creation time]_[OK or ALM].
Recorder Information and Configuration
On recorders with multiple alarms these sections are combined and
show general information such as serial and model numbers, trip
number, battery status and description. It shows how the recorder
was started, if a start delay was active and the interval used for taking
readings.
High Alarm and Low Alarm Information
These two sections summarize the alarm occurences during the trip,
includingstatistical data.
Recorded Data Chart
The chart shows a graphical representation of the data during the
trip. As part of the UTRID-16 configuration process you set the
parameters that influence how the chart is presented.
Markers
The chart will show marks where the UTRID-16 has been downloaded
(º) or where an inspection mark has been placed with the
START/Mark or STOP button (•). It also shows Paused marks
(•) where a button press has prevented readings from being used for
statistics and alarm calculations.
USB Paused Readings
A gap is shown in the graph where the UTRID-16 was plugged into a
USB port at the time it would otherwise have taken a reading.
High Alarm and Low Alarm Information
These two sections summarize the alarm occurences during the trip,
includingstatistical data. You may see up to 5 alarms for each
direction, depending on configuration and zoom settings.
Upper Threshold values
The upper alarm thresholds are shown with red dashed lines ---- so
you can see at a glance where temperatures went above set limits.
You may see up to three lines depending on configuration and zoom
settings.
Lower Threshold values
The lower alarm thresholds are shown with blue dashed lines ---- so
you can see at a glance where temperatures went below set limits.
You may see up to three lines depending on configuration and zoom
settings.
Page 15 of 21 UTRID-16 Product User Guide, Revision 1, copyright © 2004-2016, LogTag
®
Recorders . All rights reserved.
Interpreting the Data
Figure 8: Sample report page with Multiple Alarm Thresholds
Data Evaluation - Report with multiple alarms
www.GlobalTestSupply.com
Find Quality Products Online at: sales@GlobalTestSupply.com