Chapter 5 Results from LogTag 65
the desired statistics on in the Chart Statistics (on page 89) section in the Options (see
"Customizing the software" on page 86) Window. The chosen values will be displayed
separately for each chart.
You can also view Min, Max and Average Charts (see "Special Chart Tabs" on page 68),
and select other options.
Changing Chart Colours
By default, all charts in the Multi Chart display are displayed in the colors specified in the
Charts (on page 90) section within the Options (see "Customizing the software" on page
86) Window.
To change the display color of individual charts/sensors, move the mouse pointer over a
chart until the tooltip is displayed. Right-click, then select "Change Chart Color" from the
popup context menu.
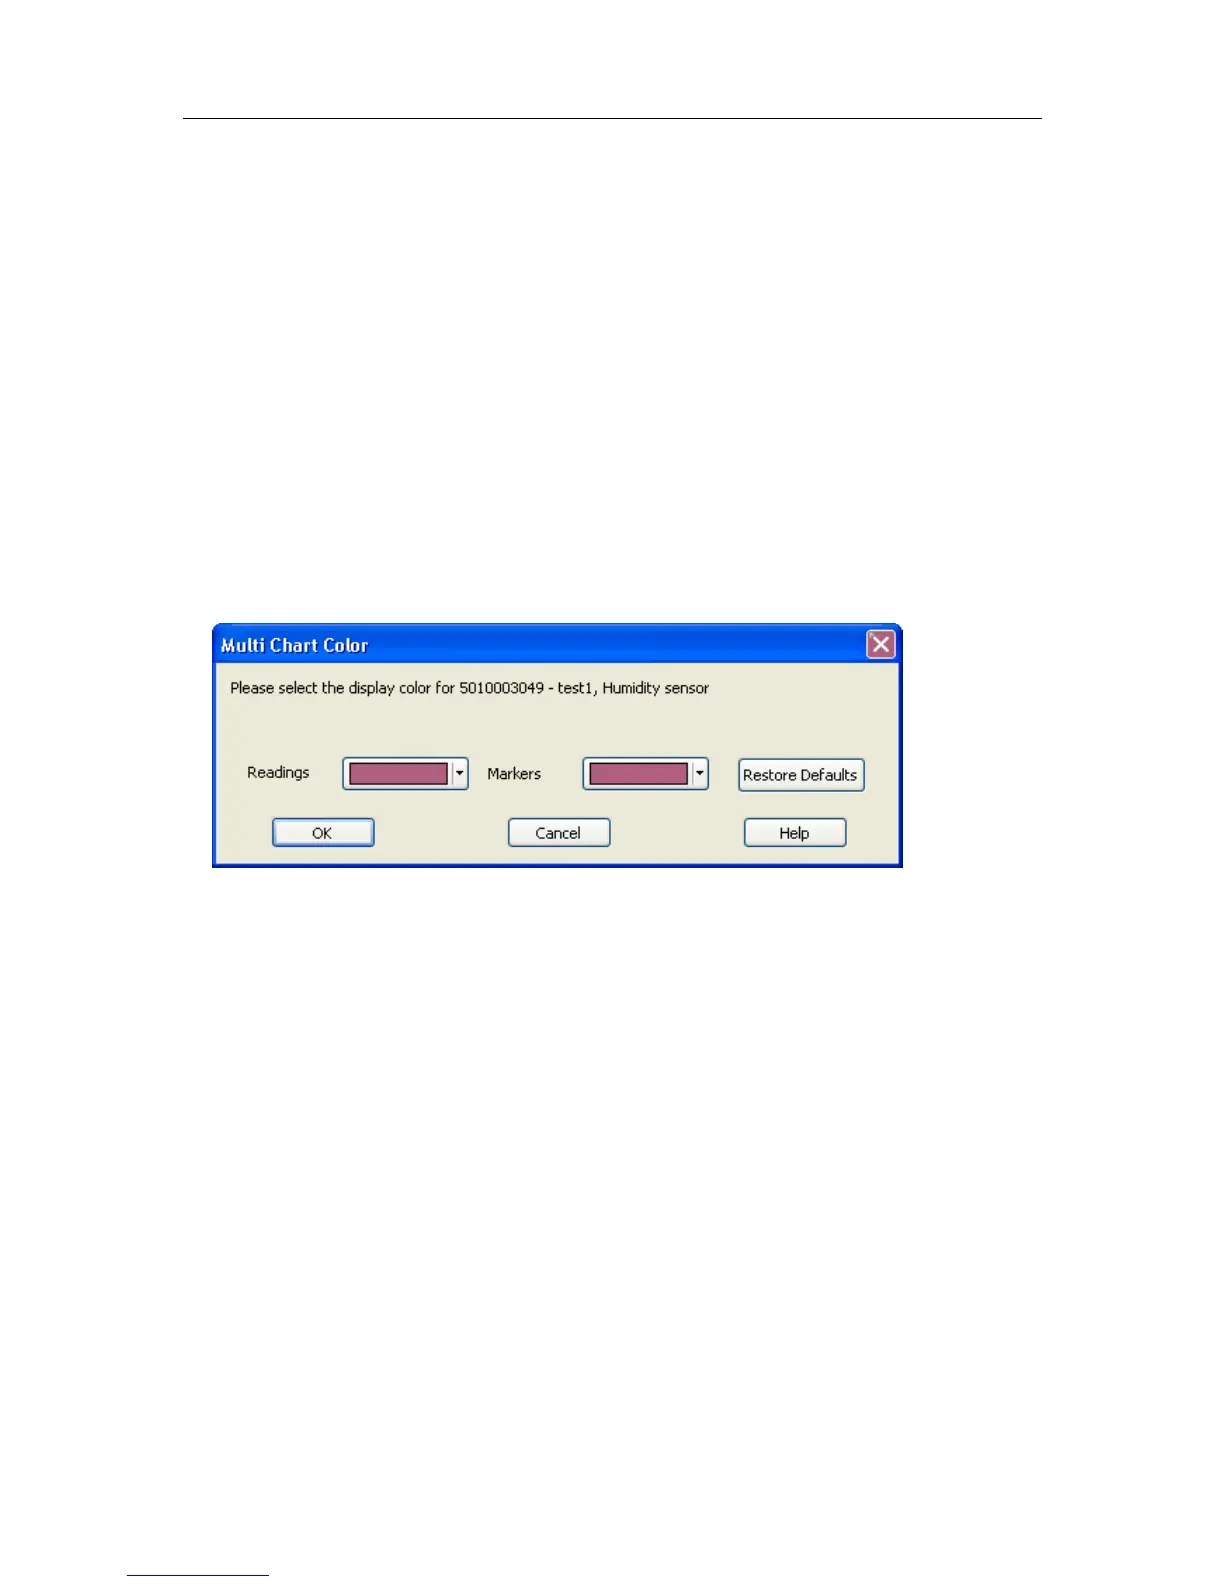
Select the desired colors for the chart readings and markers in the color selector boxes.
To restore the default color (as specified in the Charts (on page 90) section within the
Options (see "Customizing the software" on page 86) Window), select the "Restore
Defaults" command.
Shifting chart start times
For easier data comparison, chart start times can be shifted in Multi Chart display. There
are two ways to shift a chart along the time axis: