64 LogTag Analyzer User Guide (2.0)
Combining charts onto a
single chart
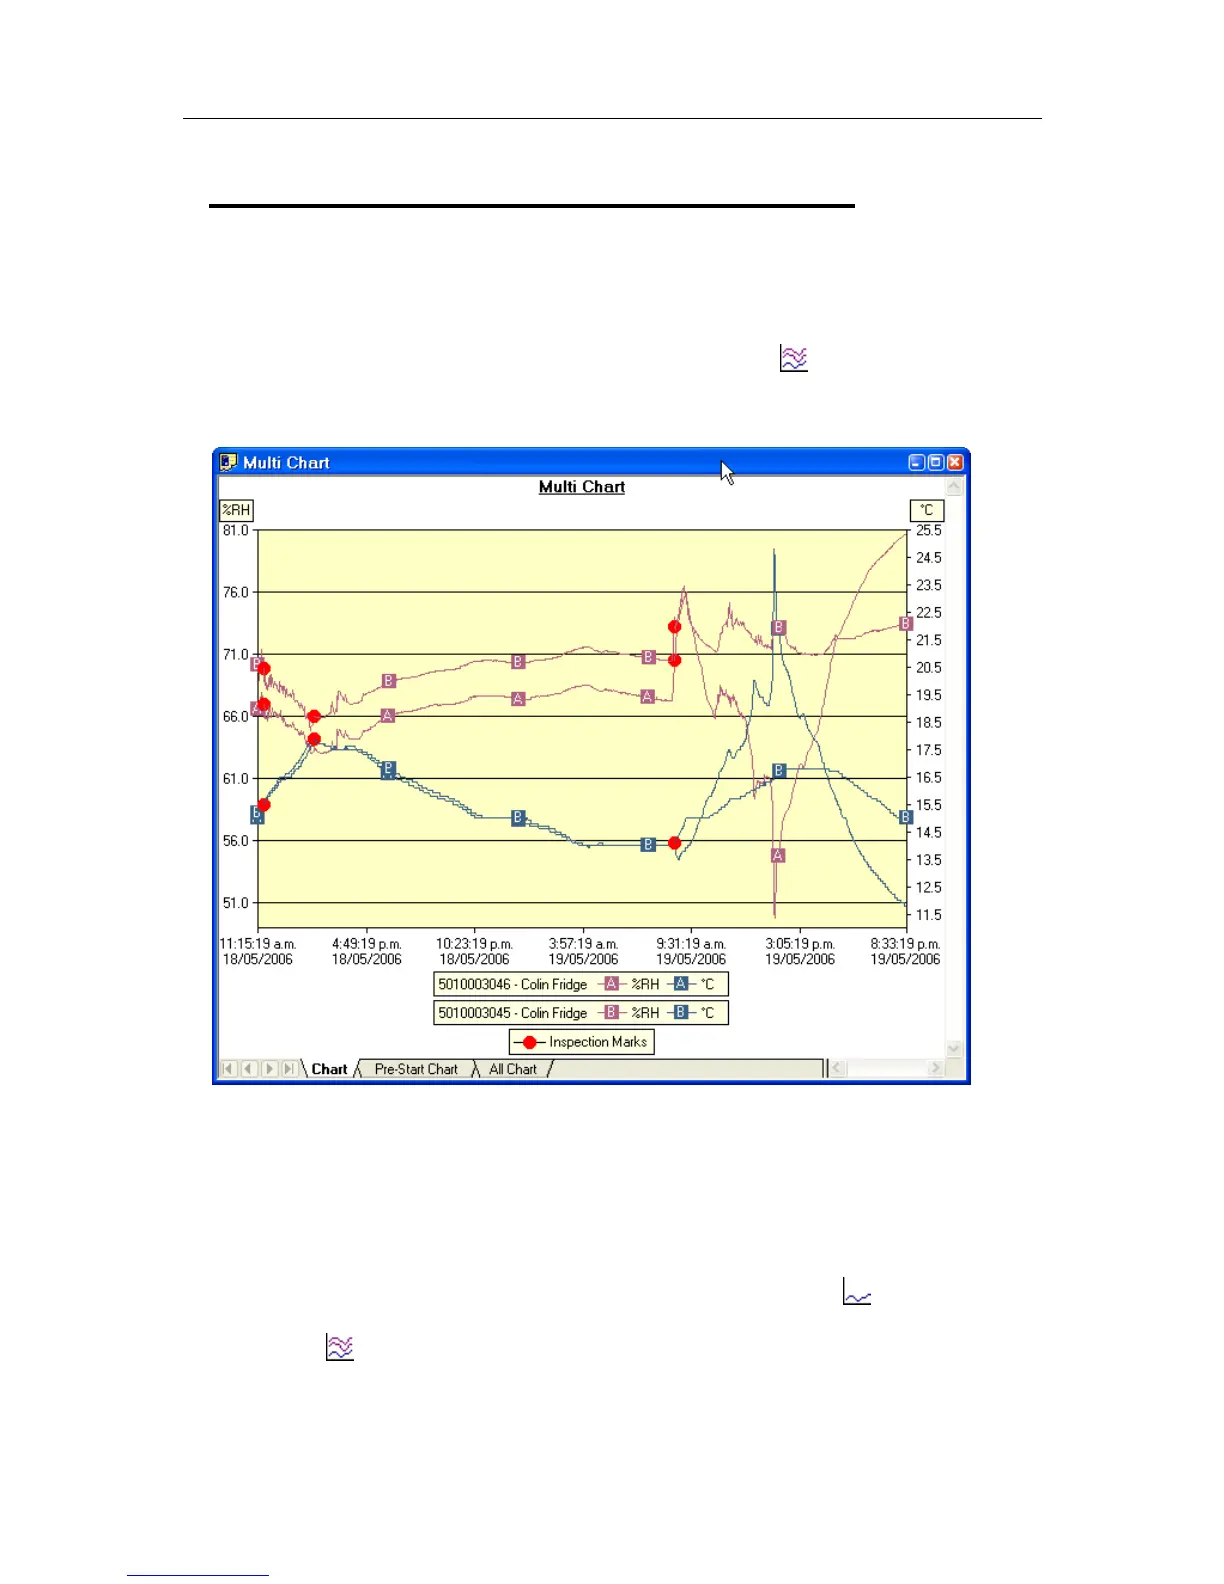
To overlay multiple charts in one view, select the Multi Chart ( ) command. All charts
that are currently open will be displayed together. Additional files opened while in Multi
Chart mode (including data downloaded from LogTags) will be added to the display.
Each of the individual charts will be displayed with a letter symbol to allow you to tell
them apart. The legend contains an entry for each chart showing the chart name and the
corresponding letter.
You can change the background color for the Multi Chart display through the Charts (on
page 90) section in the Options (see "Customizing the software" on page 86) Window.
To remove charts from the Multi Chart display, use the Single Chart (
) command to
switch to Single Chart mode, then close the files you don't want to display. Select the
Multi Chart (
) command to switch back to Multi Chart mode.
You will notice that the Data and Summary tabs are not available in the Multi Chart
display. If you require additional information about the chart data, activate the display of