NATIONAL CRANE Published 11-01-2020 Control # 710-00 7-23
NBT60XL OPERATOR MANUAL RATED CAPACITY LIMITER
- 1 — # Block — Indicates the number of the active
fault already in the control system, use the arrow
keys to scroll. Numbers are 1 through 20 with
maximum of 20 faults.
- 2 — Device Number
- 3 — Group Number
- 4 — Index
- 5 — Error Number
• Logged Fault Box (B, Figure 7-9) — Logged faults are
not currently active. Use the up/down arrows to scroll
through the codes.
Table 7-16 shows the navigation icons on the active alerts
screen.
Viewing the Fault Codes List
Access the list of fault codes (diagnostics screen #2) from
the Diagnostics menu. Use the directional button to scroll
through the list of faults.
To access the fault codes menu:
1. Press the function key.
2. Use the directional key as needed to scroll through the
fault codes.
Viewing Real-Time I/O Diagnostics Screens
Use the following procedure to view the real-time Input/
Output (I/O) diagnostics screens. Use the directional button
to scroll through the following I/O status screens:
• Module Status
• CAN Status
• ESTOP Status
• RCL Status
• RCL Master Inputs
• RCL Master Outputs
• RCL Display Inputs
• RCL Display Outputs
• Remotes Module
• Throttle Module Outputs
To view real-time I/O diagnostics:
1. Navigate to the Diagnostics Menu. See “Accessing the
Diagnostics Menu” on page 7-22.
2. Press the I/O function key.
The Real-time Diagnostics screen appears.
3. Use the directional button to scroll through the real-time
I/O screens.
About the Manitowoc Diagnostic Code
Mobile Application
The Manitowoc Diagnostic Code Mobile Application is a free
mobile application that enables the user to enter and retrieve
information about specific crane fault codes on a mobile
device. The application is available from the Google and
Apple stores and compatible with most Android and Apple
mobile smart devices.
To look up a fault code with the Manitowoc Diagnostic Code
mobile application:
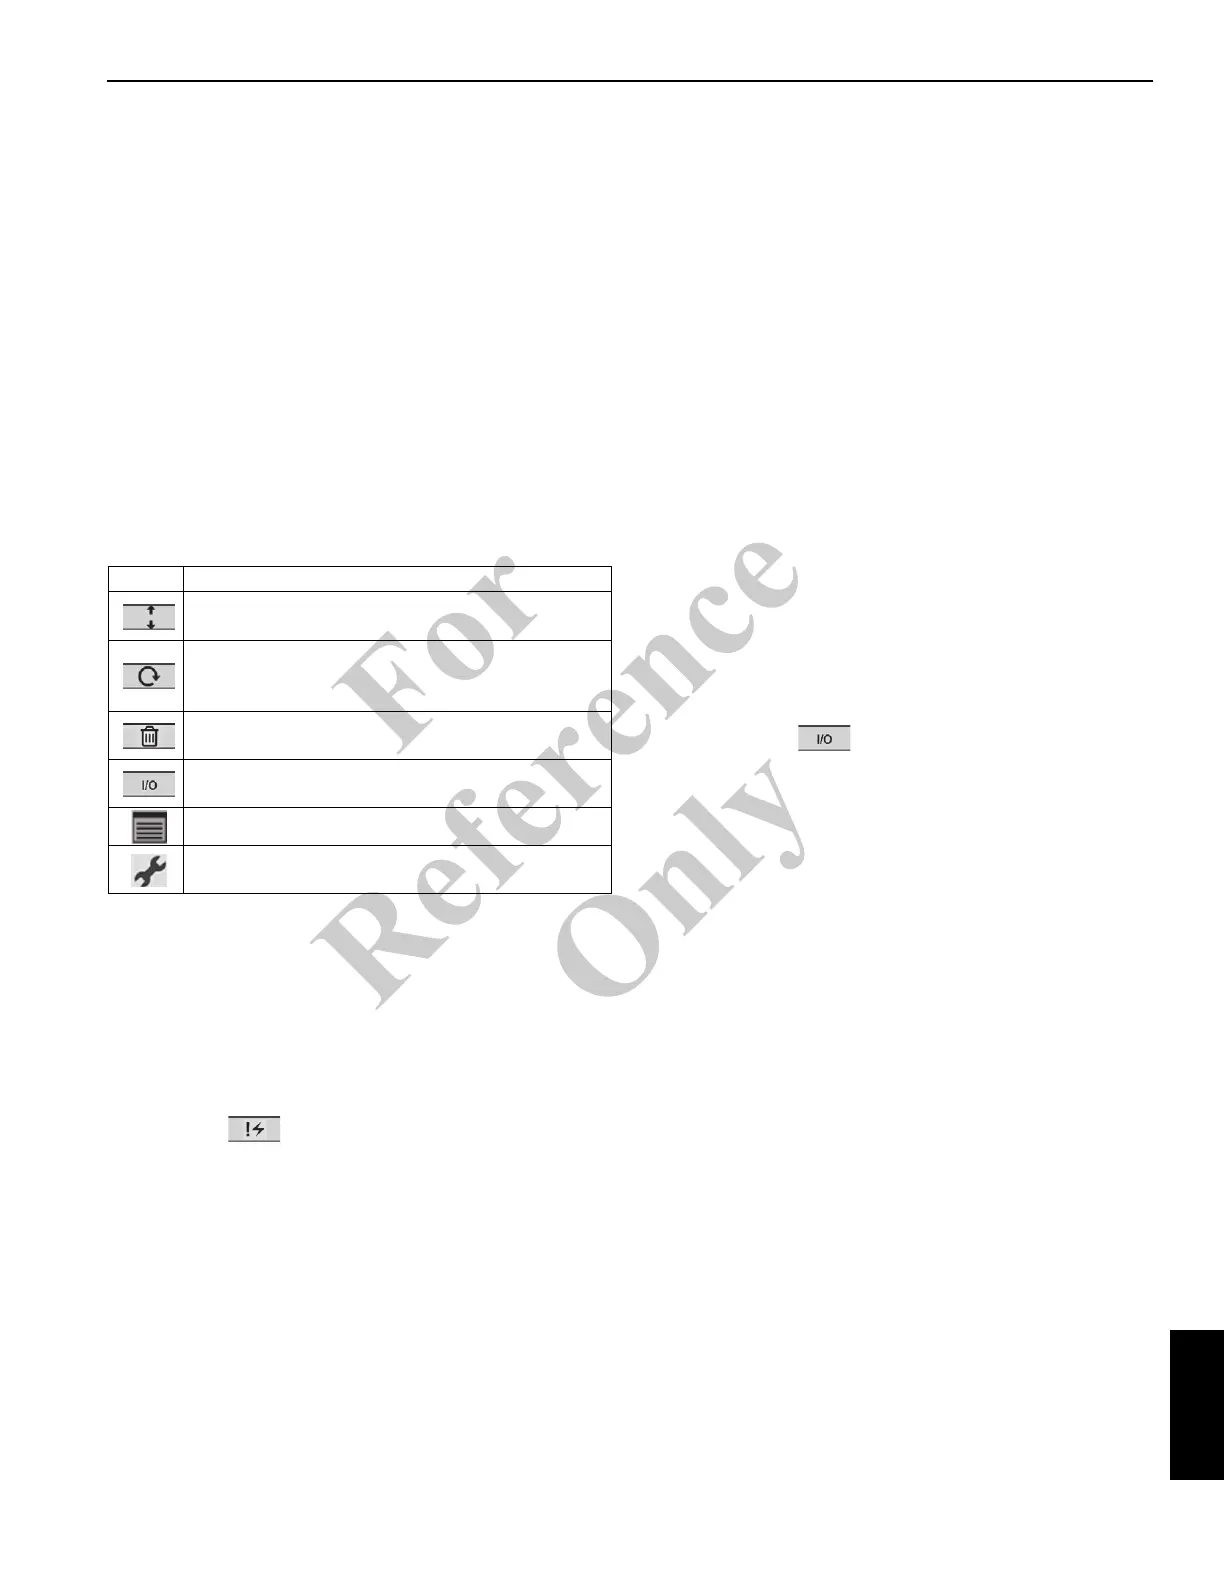
Table 7-16 Fault Screen Navigation Buttons
Icon Description
Press the UP/Down button to highlight the
Logged Fault Code Box.
Press the circular arrow button (#3) to scroll
through the faults for either the “Active” or
“Logged” faults.
Button #4 changes to “delete” when the clear log
icon is selected.
Button #2 navigates to real-time IO screen when
pressed.
Press button (#5) to navigate to the Main Menu.
Press button (#1) to navigate to the Diagnostic
Screen #1.
Fo
r
Reference
Only
 Loading...