MI 3201 TeraOhm 5 kV Plus Measurements
32
5.7 Step Voltage Insulation Resistance testing
Selecting this function displays the following states (initial state and state with results
after the completion of the measurement). Fig. 22 shows states when Graph R(t) is
disabled.
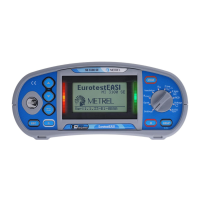
Initial display
Display with results
Fig. 22. Step Voltage function display states- Graph R(t) disabled
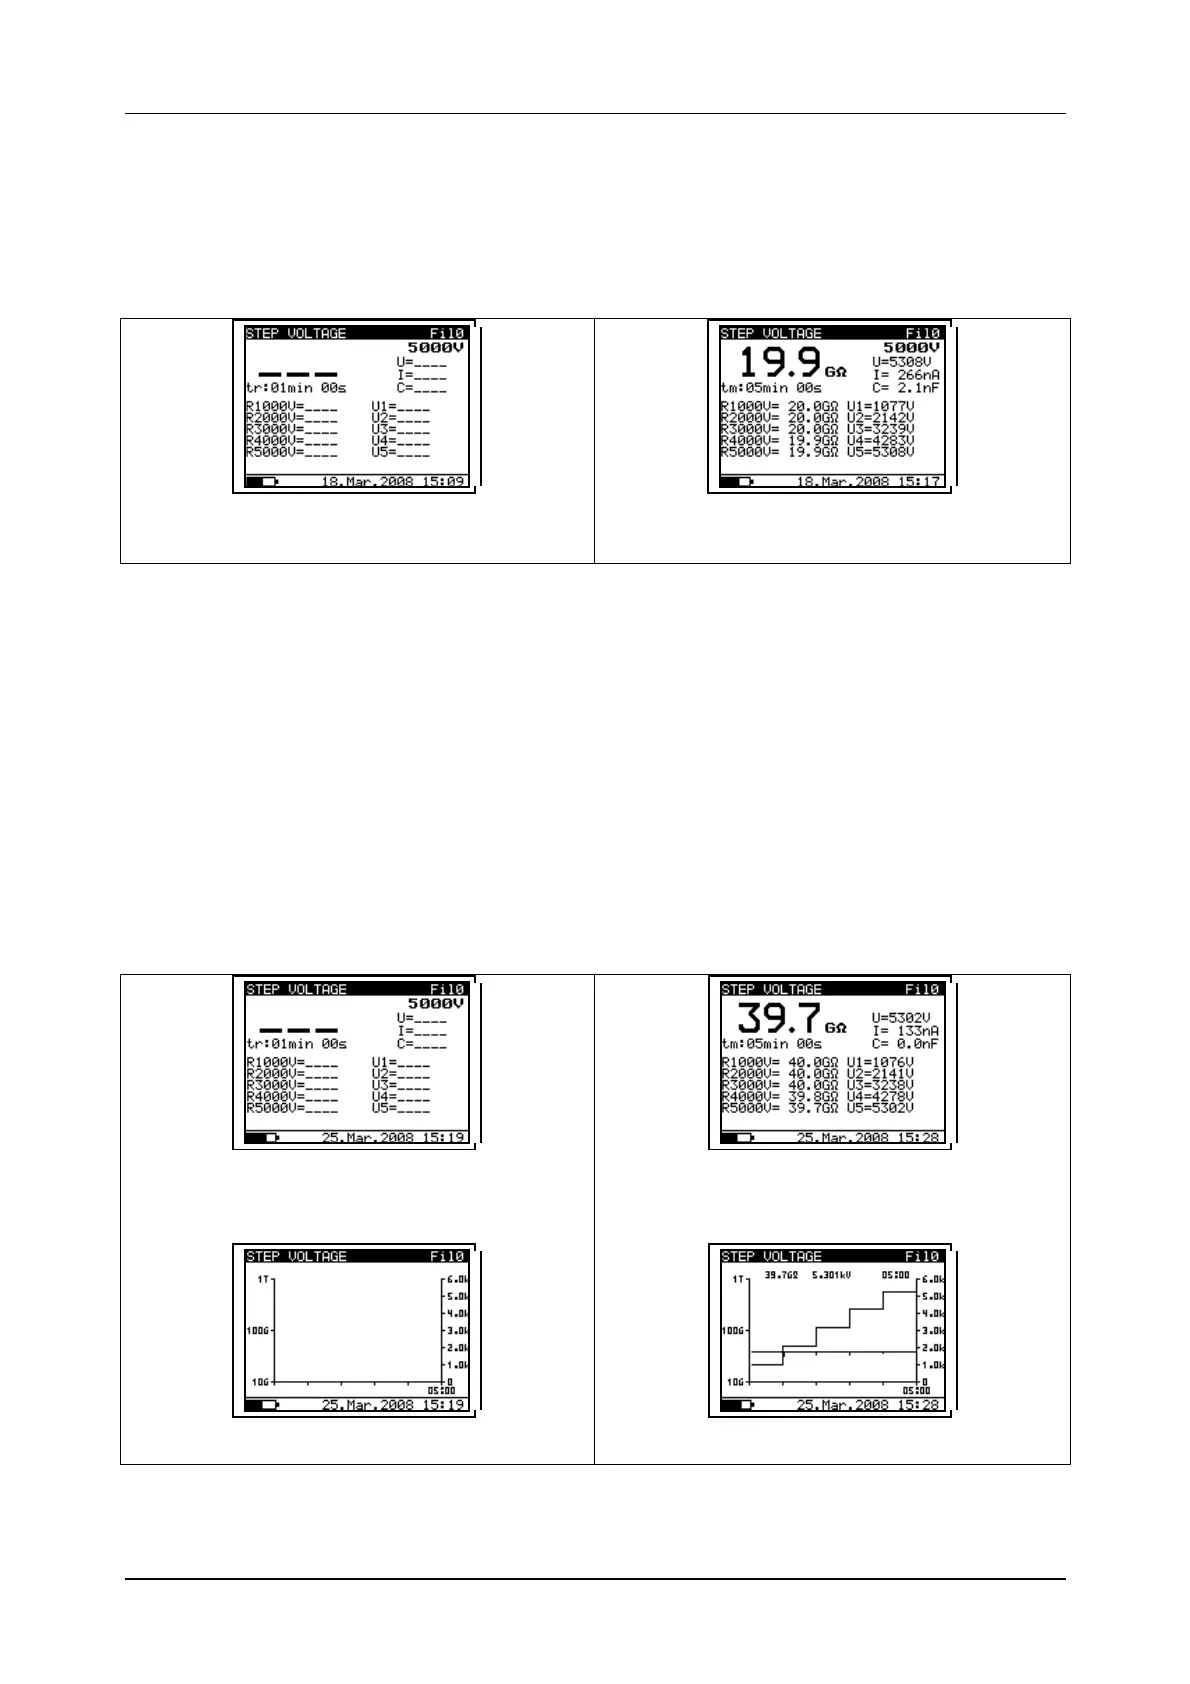
Fig. 23 shows states when Graph R(t) is enabled. When Graph R(t) is enabled you can
simple switching initial state and state with results after the completion of the
measurement, between numerical and graphical mode with pressing or keys.
graphical mode
numerical mode
Note:
- It is not possible to switching mode of presentation when measurement running!!!
Initial display - numerical mode
Initial display - graphical mode
Display with results - numerical mode
Display with results - graphical mode
Fig. 23. Step Voltage function display states - Graph R(t) enabled