36
OpenSPR 1-Channel Operation Manual V4.1.01
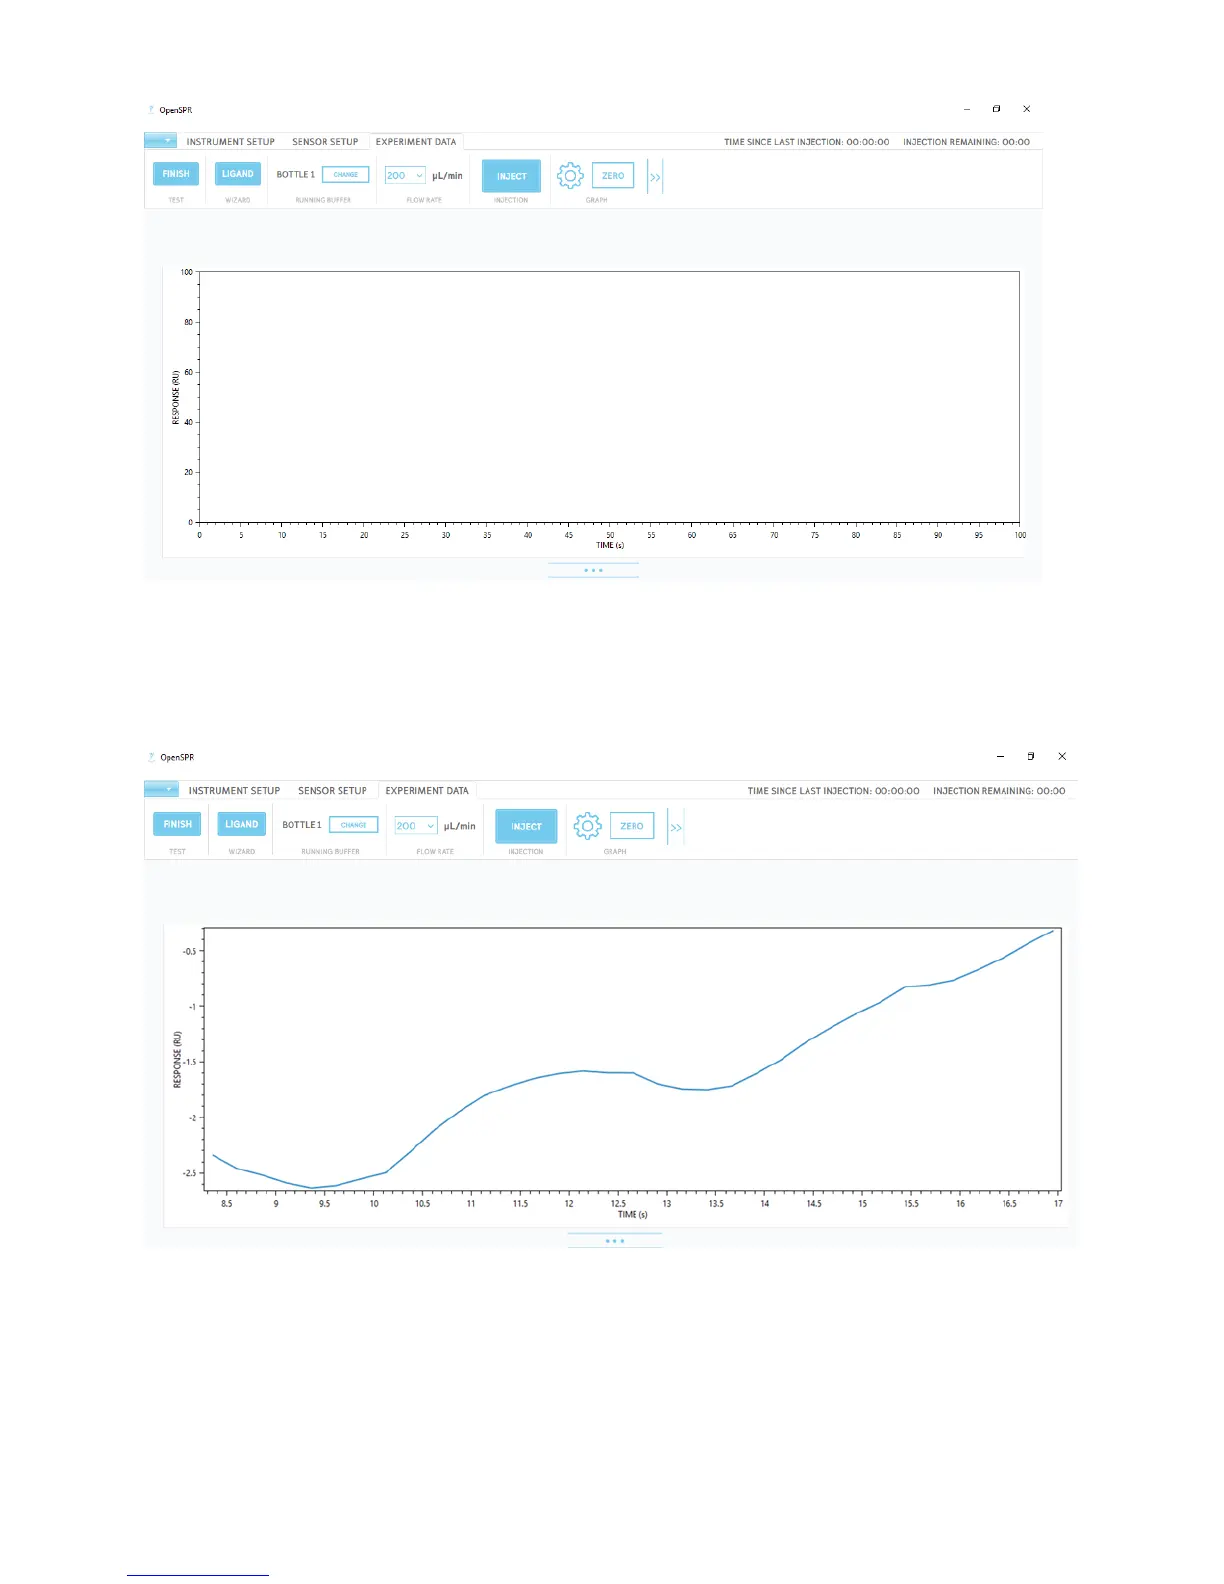
Figure 2.41 Experiment Data test interface.
After about 30 seconds, real-time data will begin streaming into the graph [Figure 2.42]. The axes
scales will start very small and will automatically grow to accommodate the data in both x and y
as data is collected. Approximately 4 points per second for each channel is being acquired.
Figure 2.42 Initial real-time data streaming into the response graph.