48
OpenSPR 1-Channel Operation Manual V4.1.01
• The graph can be moved in the x and y axis by holding the left mouse button and dragging
the mouse.
• The graph can be zoomed in and out by using the scroll wheel on a mouse, or the pinching
and expanding finger gestures on a trackpad.
• A single axis can be scaled by hovering the mouse on either the x or y axis, while using a
scroll wheel on a mouse or the pinching and expanding finger gestures on a trackpad.
• The graph can be zoomed in and out by holding the middle mouse button and selecting a
boxed area to zoom in to.
• The axes minimum and maximum values of the graph can be individually assigned by
using the advanced controls (see section above)
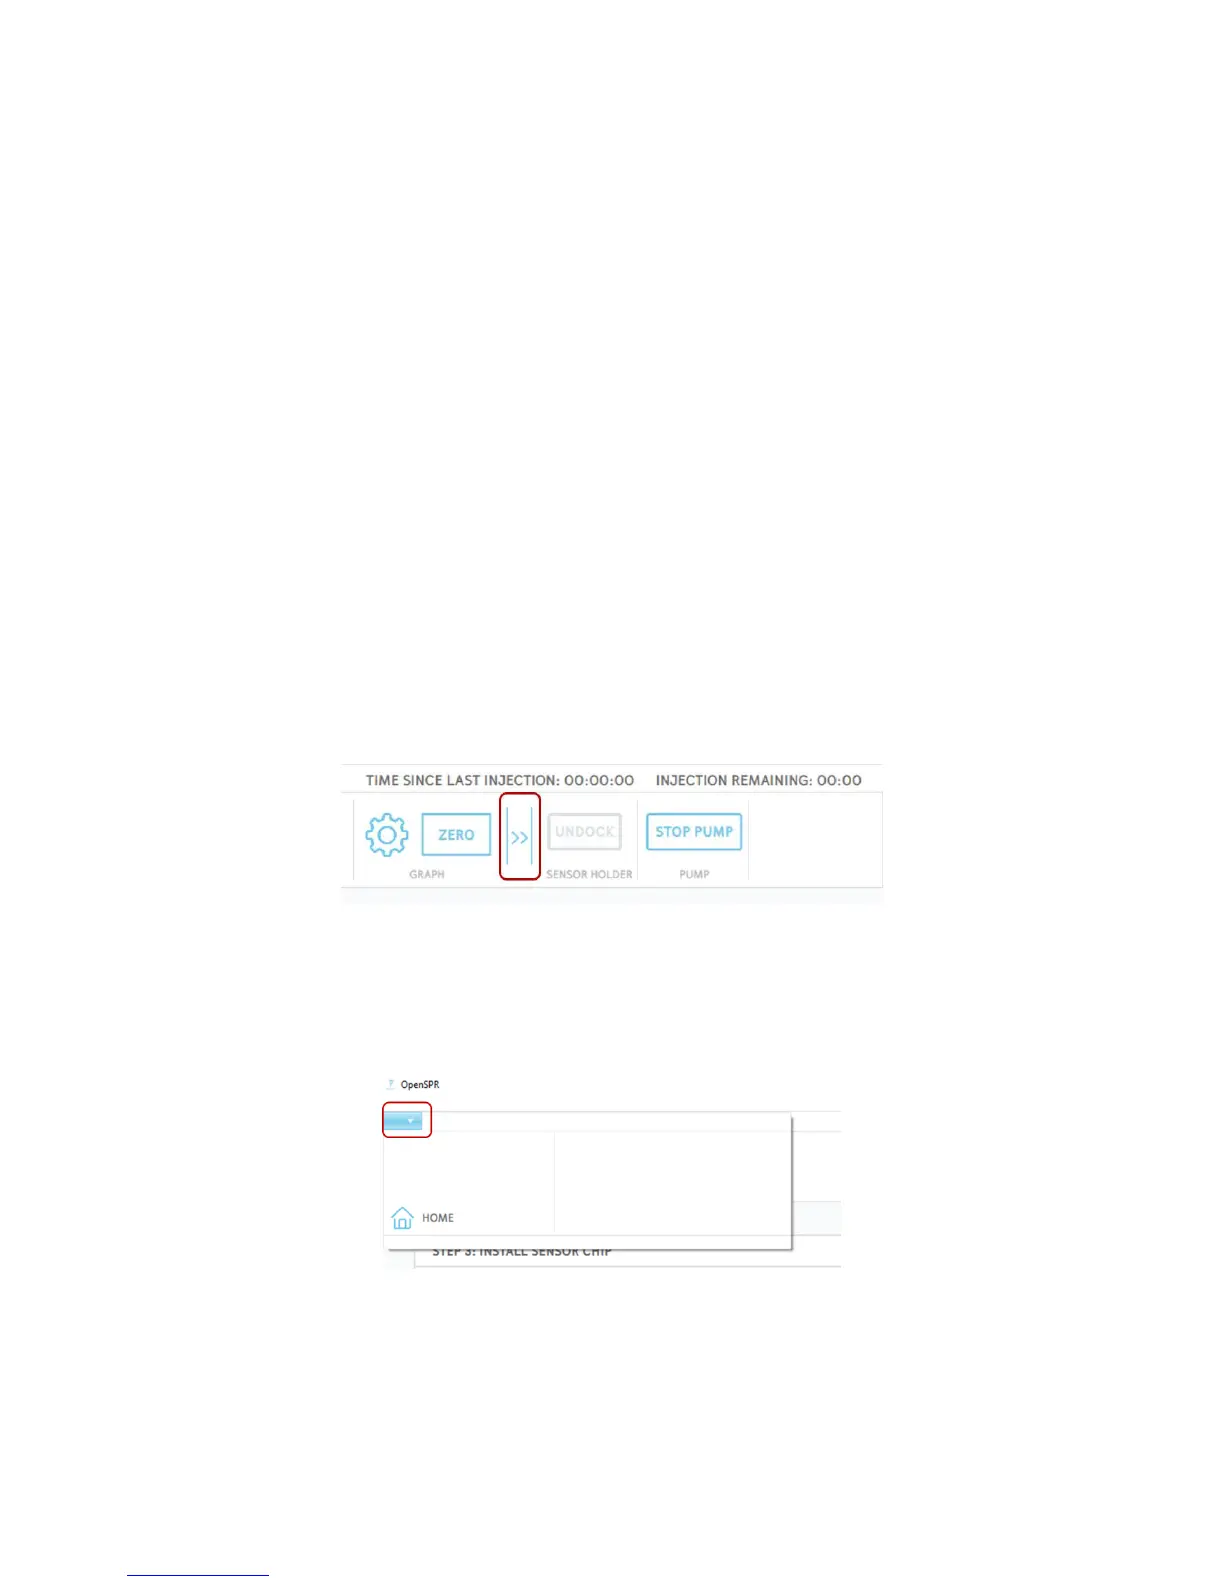
2.5.8 Advanced Controls
On the right-hand side of the menu bar, there is a bar which allows you to open advanced
instrument controls [Figure 2.64]. Normally during a test, the user should not have to use these,
but they do give flexibility when a special circumstance arises, or troubleshooting is needed.
Namely, the user will have to ability to start and stop the flow in the OpenSPR, and when the flow
is stopped, the user can then undock and dock the sensor stage. Typically, these controls should
only be used if leaking arises from the flow cell during a test.
Figure 2.64 Advanced controls menu open.
Additional advanced options can be accessed through the arrow at the top left of the menu bar
[Figure 2.67]. In here, the user has the ability to return back to the home screen by selecting the
“Home” option. This option can be accessed at any point within the software environment.
Figure 2.65 Advanced options menu located in top left of menu bar.