47
OpenSPR 1-Channel Operation Manual V4.1.01
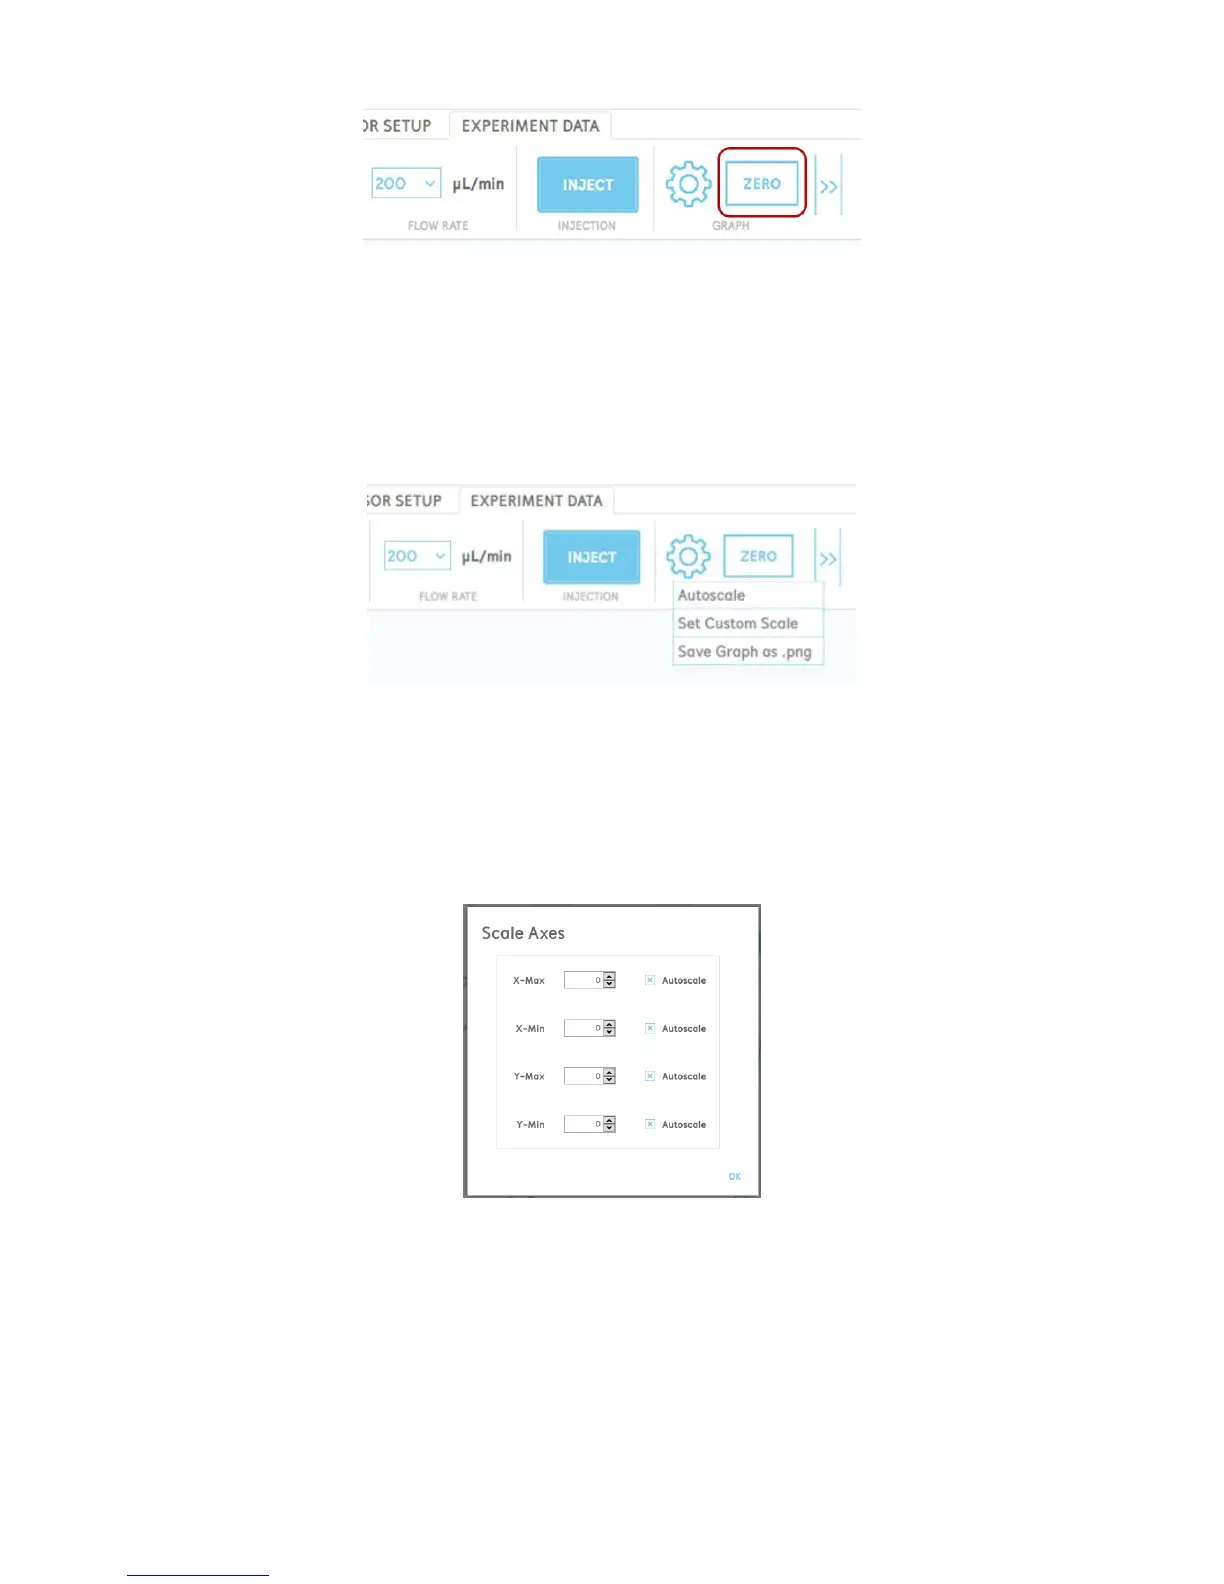
Figure 2.61 Button to zero the graph in the menu bar.
Advanced Graph Controls
By clicking the gear (settings) button in the graph menu, the user will have the options to
autoscale the graph, set custom axes, and save an image of the graph [Figure 2.62].
Figure 2.62 Graph settings menu.
Autoscaling the graph will return the x and y-axis scales back to the default values to encompass
all of the data displayed in the graph.
Selecting “Set Custom Axes” will open a menu which will allow you to manually set the minimum
and maximum values of both the x and y-axes [Figure 2.63].
Figure 2.63 Set custom axes menu.
Manual Adjustment of the Graph
The response graph axes will autoscale by default as the data points are collected and the signal
changes. However, it can be desirable to zoom in or out on certain areas of the graph as the test
progresses. The various functions of manually adjusting the graph are described below: