© 2005-2016 Nira Control AB 64
By moving the mouse pointer over a gauge, alternative display options will
be shown as buttons that can be clicked. You can move a gauge by dragging
and dropping the gauge. The panel has an invisible grid to which a gauge
will snap when moved. This makes it easy to create panels with a clean,
organized look.
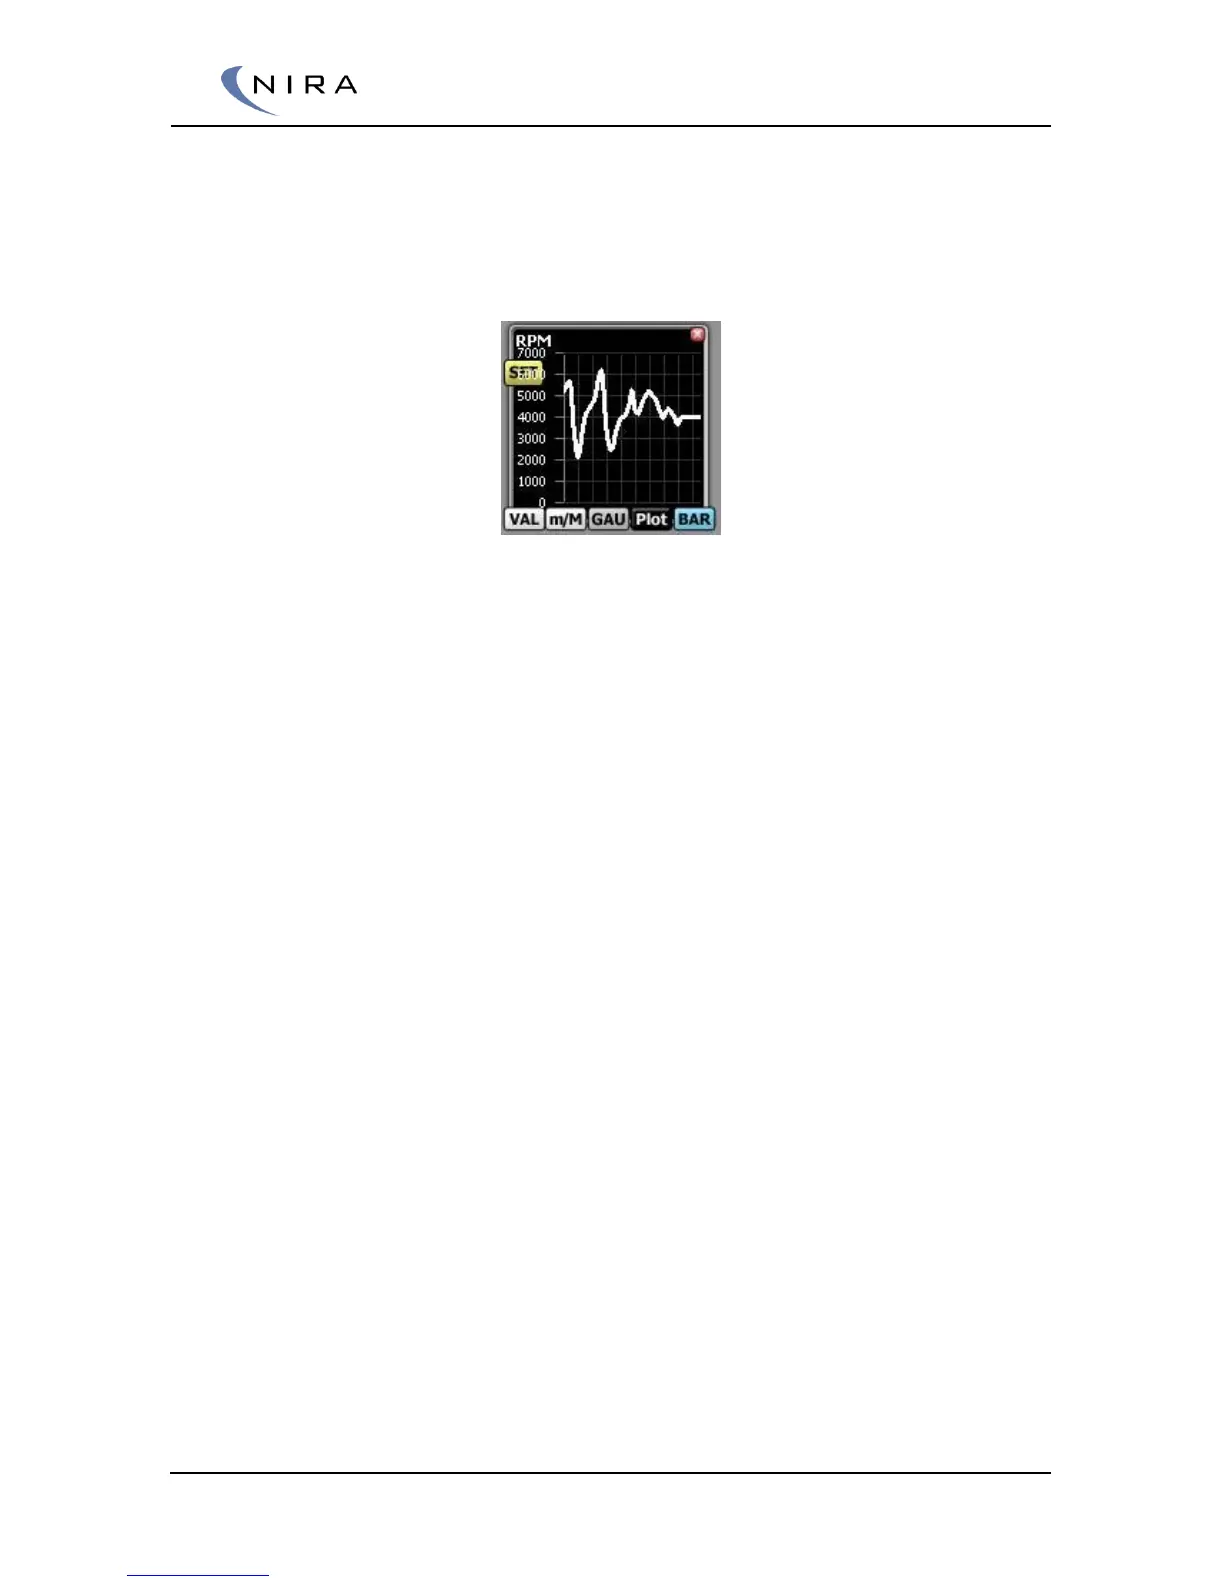
Picture 4-23: By moving the mouse pointer over a gauge, display options are shown as
buttons that can be clicked.
Referring to picture 4-23 above:
Clicking on the X in the top right corner of the gauge removes the gauge
from the panel.
The buttons at the bottom of the gauge change the look of the gauge:
• VAL means Value. Selecting this option turns the gauge into a simple
value display. The Battery Voltage gauge in picture 4-22 is an example
of the Value look
• m/M means min/Max. Selecting this option turns the gauge into a
Value display (see above) with additional min/Max displays. A Reset
button lets you set the min/Max values to the current value
• GAU means Gauge. Selecting this option turns the gauge into a
traditional analog gauge. The RPM gauge in picture 4-22 is an
example of the Gauge look
• Plot turns the gauge into a histogram, moving from right to left. The
width of the histogram is relatively short, which means it’s mostly
useful for looking at short-duration events. If you want to capture
longer durations and graph them, use the logging feature in NIRA rk.
See section 4.7
• BAR turns the gauge into a bar graph. The Engine Temp gauge in
picture 4-22 is an example of a bar graph
In the Gauge, Plot and Bar modes, there’s a ”Set” button. Double-click on it
or hit Enter to modify the range of the gauge or to revert to the default
range.
As always, F2 opens a dialog box listing all possible short cut keys.
 Loading...