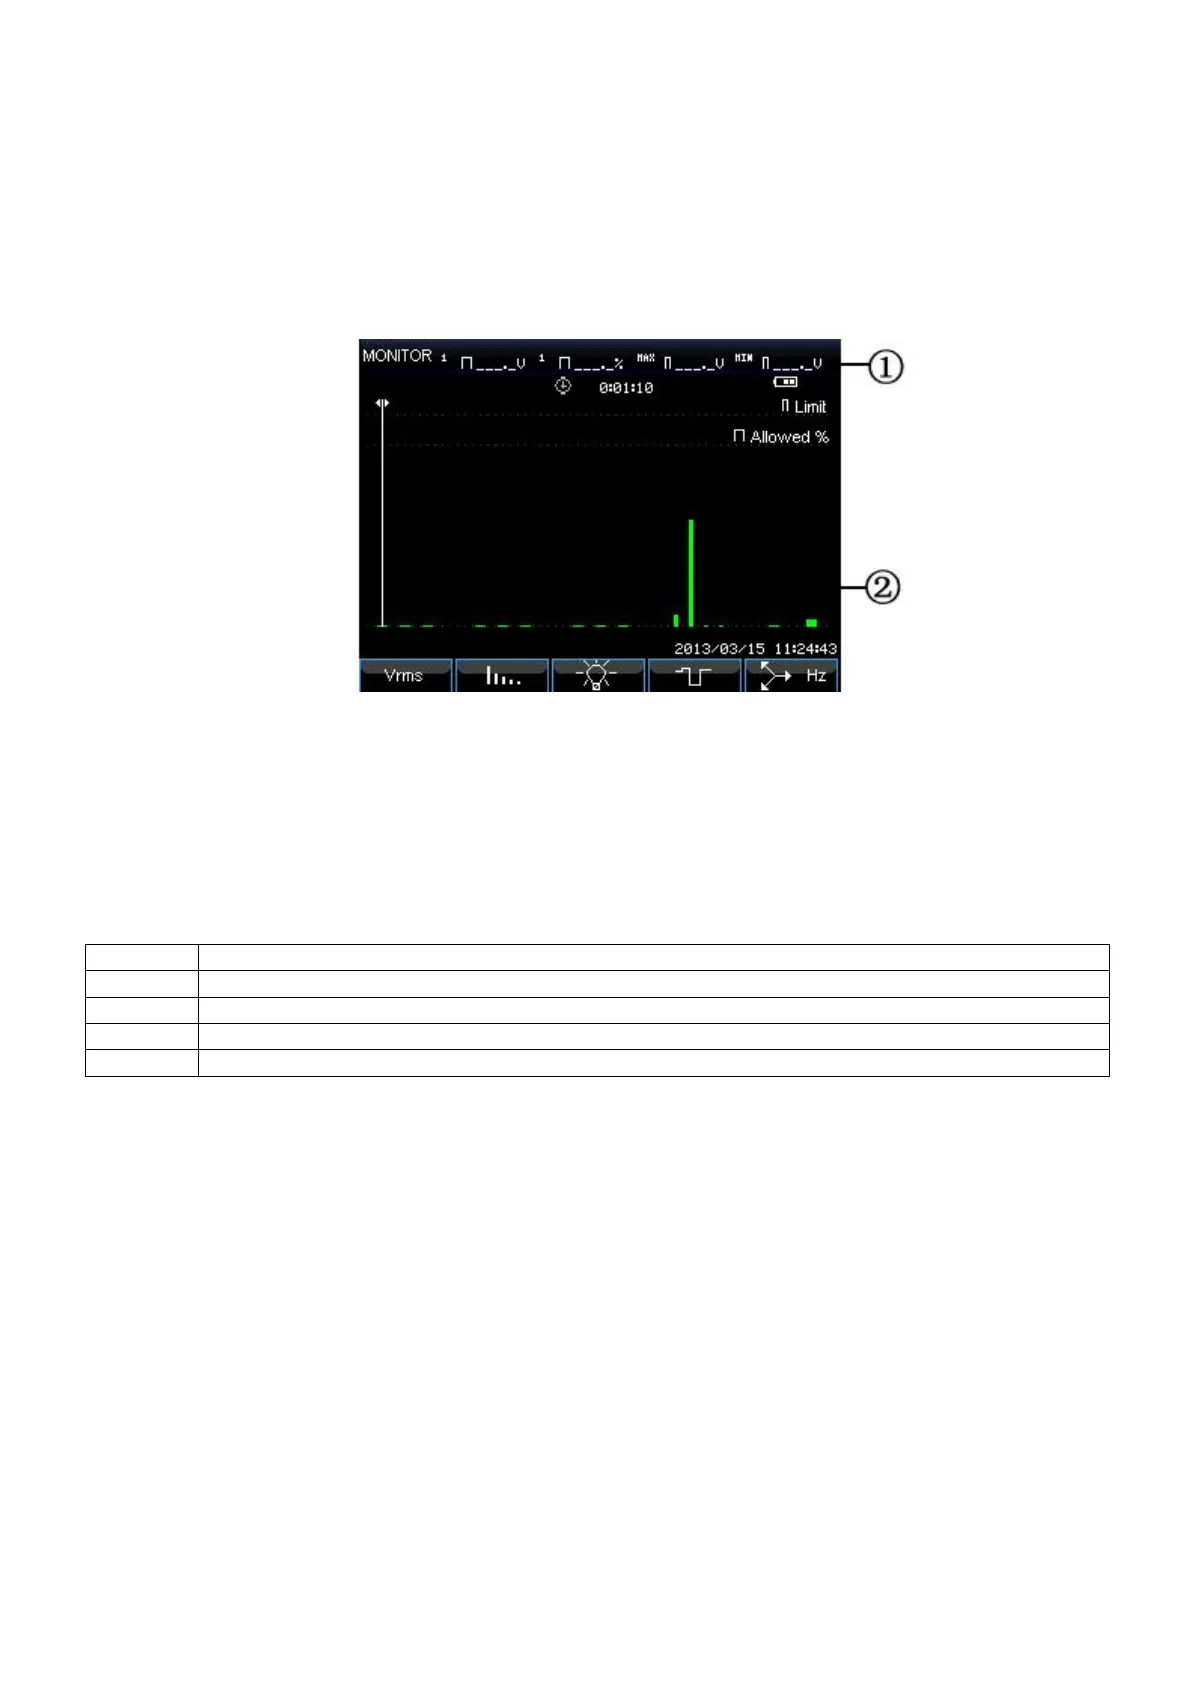
Bar graph screen
Bar graph screen contains harmonic bar graph and power quality monitoring bar graph, the bar height
indicates the percentage of represented parameter. Related parameter value will be shown in the screen
header when moving cursor to specified bar.
For instance power quality monitoring bar graph screen contains: Voltage RMS, harmonics, flicker, rapid
voltage change, dips, swells, interruption, unbalance and frequency. The related bar length will increase
if a parameter exceeds its nominal value. The below figure explains this:
Picture: Bar graph screen
Screen information:
(1) Limits value of bar graph under Cursor. Use left/right arrow keys to move cursor to another bar
graph.
(2) Power quality monitoring screen, shows parameter time within high and low tolerance by a bar.
Function keys:
Access to Voltage RMS submenu
Access to Harmonics submenu
Access to Flicker submenu
Access to Dips&Swells submenu
Access to Unbalance and Frequency submenu
-48-