PicoQuantGmbH MultiHarpSoftwareV.3.1.0.0
5.2. Setting Up and Running Interactive Measurements
TheprimarymodeofoperationoftheMultiHarpsoftwareisinteractivehistogramming.Thisiswhatthemain
windowofthesoftwareisdedicatedto.Theusercansetupmeasurementparameters,startmeasurementsand
immediatelyseehistogramdataonthescreen.Infurthersections,e.g.,onTTTRmode,youwilllearnabout
othermodesofoperationwithlessuserinteractionthatwillcollectdatastraighttodiskwithoutimmediatevisual-
ization.Here,wefocusontheinteractivehistogrammingmodeofoperation.
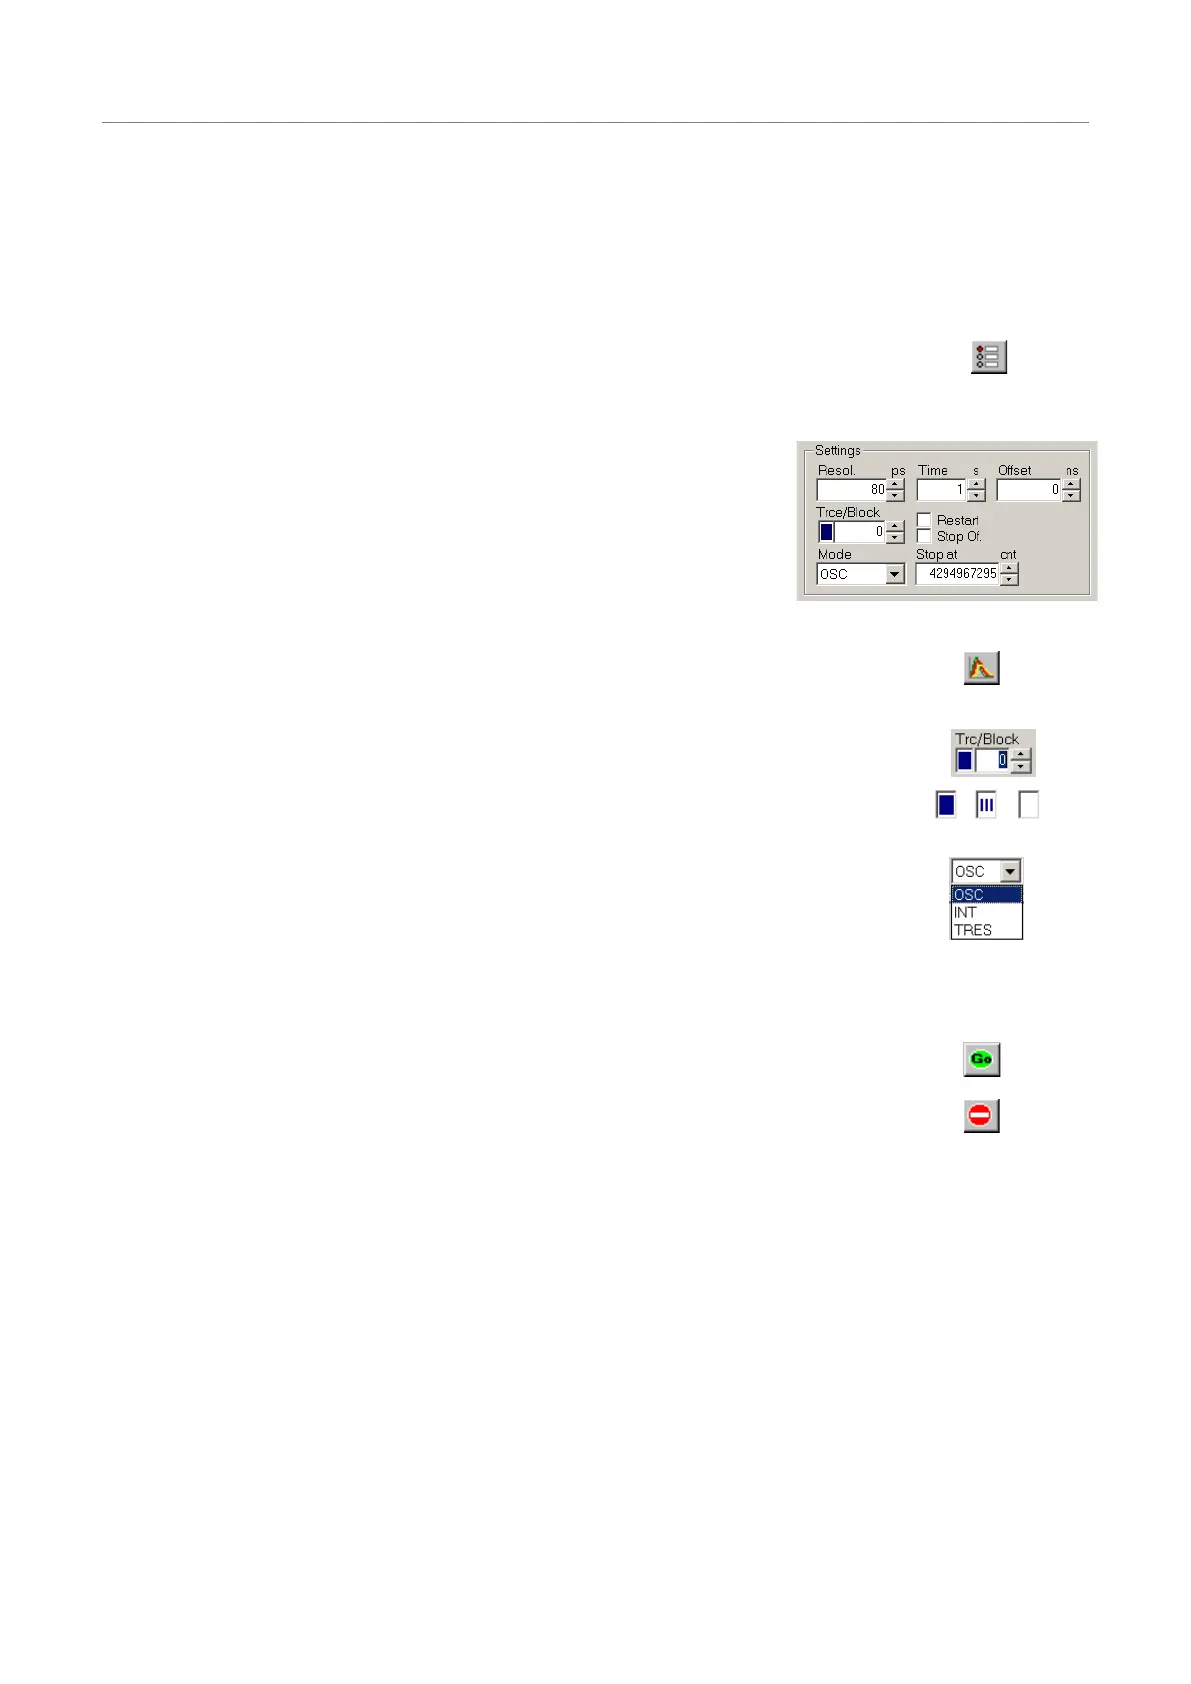
TosetupmeasurementparametersusetheMultiHarpcontrolpanel.Thecontrolpanel
canbeopenedbyclickingthecontrolpanelbuttononthetoolbarorbypressing<Alt>+C.
Inthecontrolpanelsection'Acquisition-Settings'youcansettheresolu-
tion(timeperbin),theoffset,themeasurementtime,andtheblockof
memorytouseforthismeasurement.Tobegin,useameasurementtime
of1secondandanoffsetof0.Therearealways65,536timebinsperhis-
togram.Histogramscanberecordedandstoredin512memoryblocks.
Outoftheseupto16curvescanbedisplayedandone‘active’blockcan
beusedforameasurement.Youcandesignatetheactivememoryblock
youwishtouseforthenextmeasurementbyselectingtheblocknumber
inthecontrolpanel.Neverforgettoselectanewblockwhencollecting
newdataandolddataisintendedtobepreserved.
Usethetracemappingdialogtoselectupto16curvesfordisplay.Makesurethememory
blockyoumeasureintoismappedtoadisplaytracethatisswitchedon,sothatyoucan
seethetrace.Youcanreachthetracemappingdialogfromthetoolbarorbyclickingon
thetracecolorindicatornexttotheblockselector.
Thecolorindicatorshowsthetracecolorthatthechosenblockiscurrentlymappedto.Ifit
isasolidsquare,thecurveismappedandshown.Ifitismappedbutnotshown,theindi-
catorshowsasmallstripedsquare.Ifthecurveisnotevenmappedfordisplaytheindica-
torremainswhite.
Therearetwobasichistogrammingmodesforinteractivemeasurements:Oscilloscope
andIntegrationmode.Oscilloscopemoderepeatedlycollectshistogramswithafixedmea-
surementtimeanddisplaysthemonthescreen.Thisletsyouseefastchangesinthehis-
togram,e.g.,foropticalsetupandadjustments.Usuallythisonlymakessensewithrela-
tivelystrongsignalsandshortacquisitiontimes.Integrationmodeisusuallyoperatedwith
longeracquisitiontimes.Inthiscasethehistogramcontinuestogrowoveralongertime
andthedisplayisupdatedatregularintervals,sothattheaccumulationprocesscanbe
observed.
Tostartameasurementwiththecurrentcontrolpanelsettings,usethestartbutton(GO)on
thetoolbarorpress<Alt>+G.
Tostopameasurementusethestopbuttononthetoolbarorpress<Alt>+S.
Notethatameasurementmayautomaticallystopand/orrestart,dependentonthecurrent
settingsof‘stop on overflow’and‘restart’inthecontrolpanel.
Note:toactuallyrunameaningfulmeasurementyouwillneedtosetuptheinputchannels,mostimportantly
withappropriatevoltagelevelsasoutlinedintheprevioussection.Alsoallowawarming–upperiodofabout20
minutes(dependingonlabtemperature)beforeusingtheMultiHarpforfinalmeasurements.Youcanusethis
timeforset–upchecksandpreliminarymeasurements.
Theratemeters(bottomofmainwindow)permitvisualcontrolofthedataacquisition.Notetheselectoratthe
farrightoftheratemeters.Thisselectsthechanneltheratemetersarereferringto.Selectthechannelyouare
currentlyusing.Themetersareoftentoosmalltoviewfromfurtheraway,e.g.,whenadjustingtheopticalsetup.
Youcaninthiscasesimplydouble–clicktheratemeterofinterest.Thisopensalargemeterdisplaythatyou
canthenre-sizeandmoveonthescreenasyoulike.
Onceyouhaveestablishedstandardsettingsforyourexperimentalsetupyoumaywanttosavethemtoafile.
Thecontrolpanelsettingscanthenberecalledatanytimebyloadingthatfile.Theprogramstoresallsettings
togetherwiththehistogramdataofthosecurvesinmemory(max.512)thathavebeenfilledbyameasurement.
Inadditiontothis,allsettingsarestoredintheWindowsregistry,sothatatprogramstartupyoufindthecontrol
panelasitwaswhenyoulastclosedtheMultiHarpsoftware.
Page35