PicoQuantGmbH MultiHarpSoftwareV.3.1.0.0
Event Filter Usage Walk-Through
Inthefollowingwediscussasimpleexperimentshowinghowthefilterworksandhowitcanbeprogrammed.
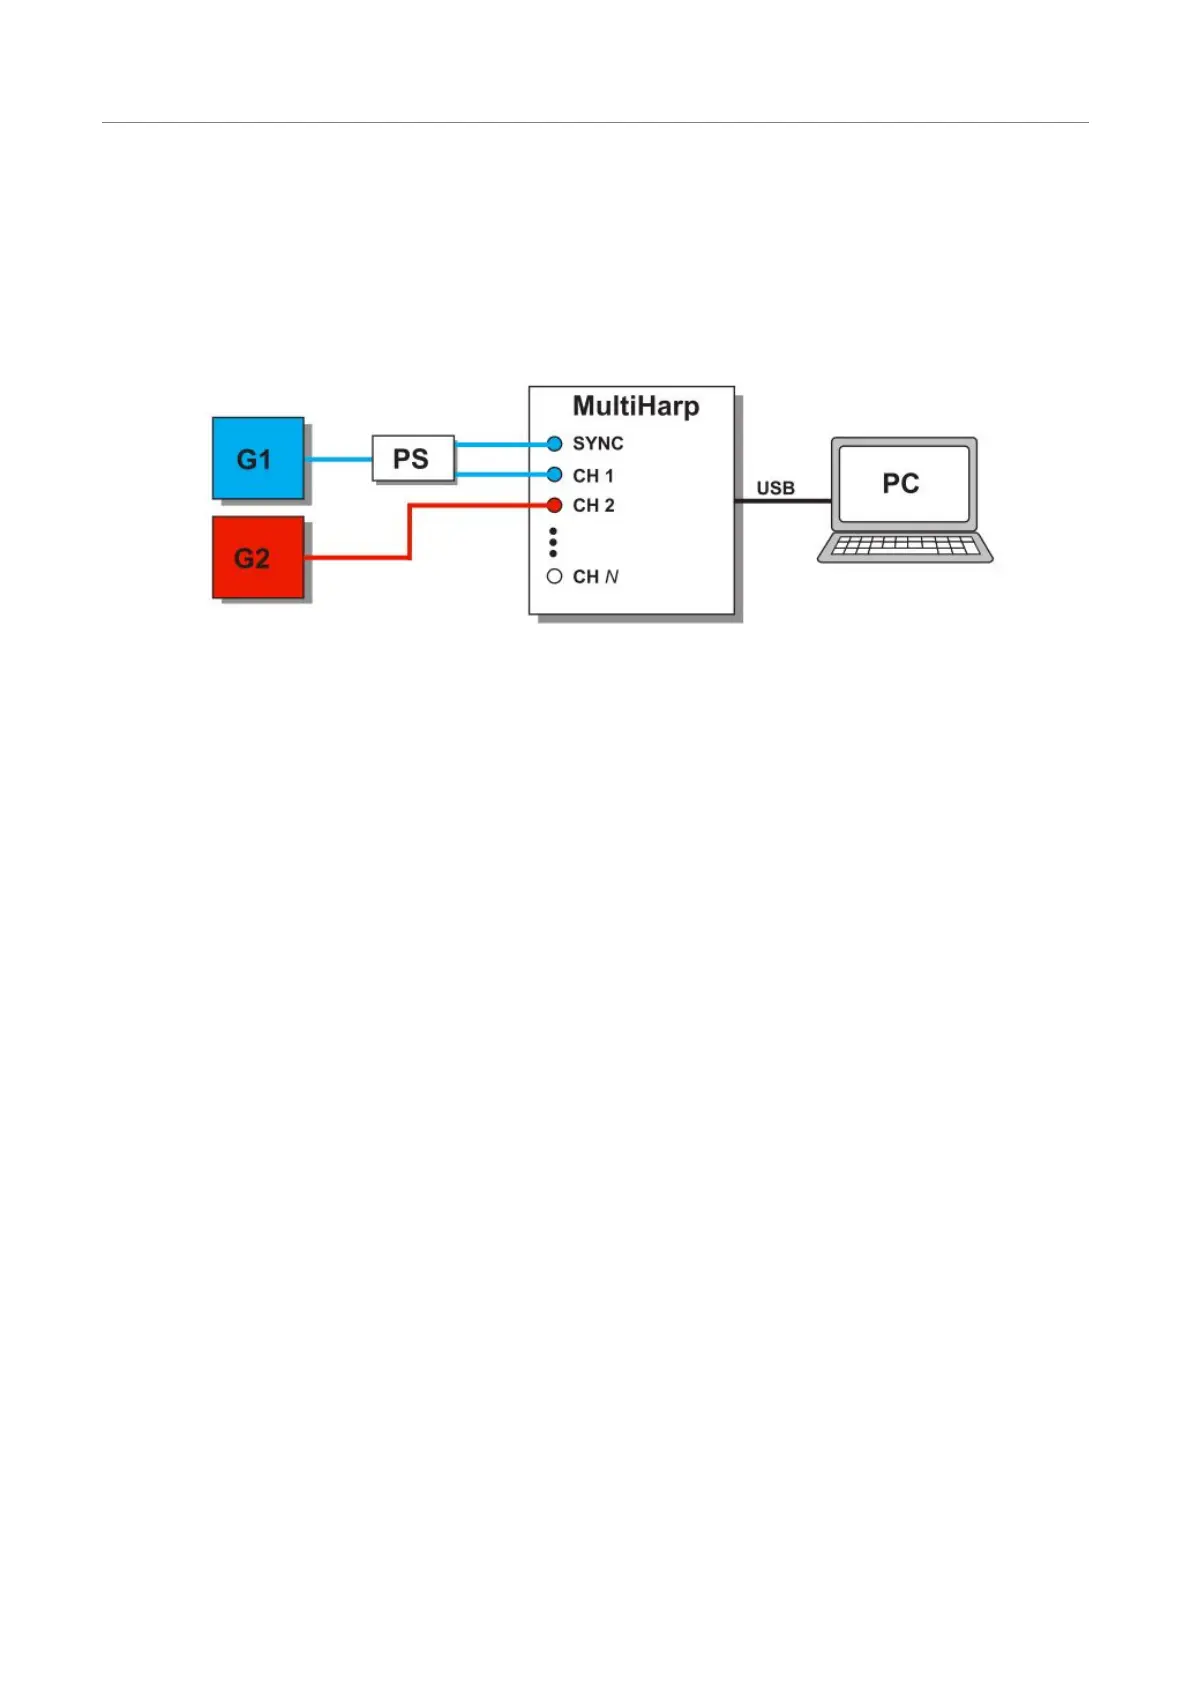
Theexperimentalsetupwewillbeusingthroughoutthissectionisshowninthefigurebelow.Forthesakeof
clarityandrepeatabilityweusesignalgeneratorsoffixedfrequencyratherthanthemostlynon-deterministicsig-
nalsfoundinquantumoptics.
GeneratorG1providespulsesatafrequencyof10MHz.Bymeansofa50Ohmspowersplitter(akareflection
freeT-pad)identicalpulsetrainsarefedtotheMultiHarp’ssyncinputandphotontiminginputchannel1.Gener-
atorG2providesanindependentperiodicpulsetrainof1MHzthatisfedtotheMultiHarp’sphotontiminginput
channel2.Thegeneratorfrequenciesandthechoiceofinputchannelsaresomewhatarbitraryandweonlypin
themdownhereforconsistencywithinstrumentsettingsandexperimentalresultsshownfurtheron.
WhileeventfilteringisafeatureavailablesolelyinTTTRmode,itishelpfultofirstconsiderwhatkindofresults
theywouldgenerateinhistogrammingmode.Indeedtheexperimentalsetupwasdesignedtopermitthisandfor
didacticpurposesyouareencouragedtotryitout.GiventhatthesignalsfromG1areidenticalonsyncandin-
putchannel1,thetimedifferencebetweenthemisconstant,exceptforasmallstochasticmeasurementerrorof
afewps.Therefore,onewouldexpectahistogramlookinglikeasharpspike,infactagaussiandistributionwith
awidthcorrespondingtotheinstrument’stiminguncertaintyofafewps,providedwerunitatthebestpossible
resolution.Withidenticalcablelengthsafterthesplitterweshouldexpectthepeaktositattimezeroofthehis-
togramaxis.Sincethehistogramresultsfrompositivetimingdifferencesbetweeninputchannelandsync,we
wouldonlybeabletoseethepositivehalfofthepeak.Inordertoseethefullpeakitisusefultointroduceade-
layintheinputchannel.Thiscanbedonephysicallybymeansofcable,butonegreatfeatureofPicoQuant’s
TCSPCsystemsisthatthesamecanbeachievedbymeansofaprogrammableoffset,soweusethelatterand
setitto30ns.ThesignalfromG2istemporallyindependentfromG1sothatthecorrespondingtimedifference
istakingallpossiblevalueswithinthesyncperiod,i.e.the100nsperiodofG1.Oversomesufficientmeasure-
menttimewewouldthereforeobtainahistogramthatisevenlyfilled,withonlysomestatisticalfluctuationsac-
cordingtocountingstatistics.Thefigurefollowingbelowshowstheactualmeasurementresults.
Page44