19
M-43-25 LUF-Series Lufran Manual
Revision - Date 03-01-04-18 Standard outlet, Standard Interface
Engineering Information (Continued):
Operator Interface Panel (OIP) (Continued):
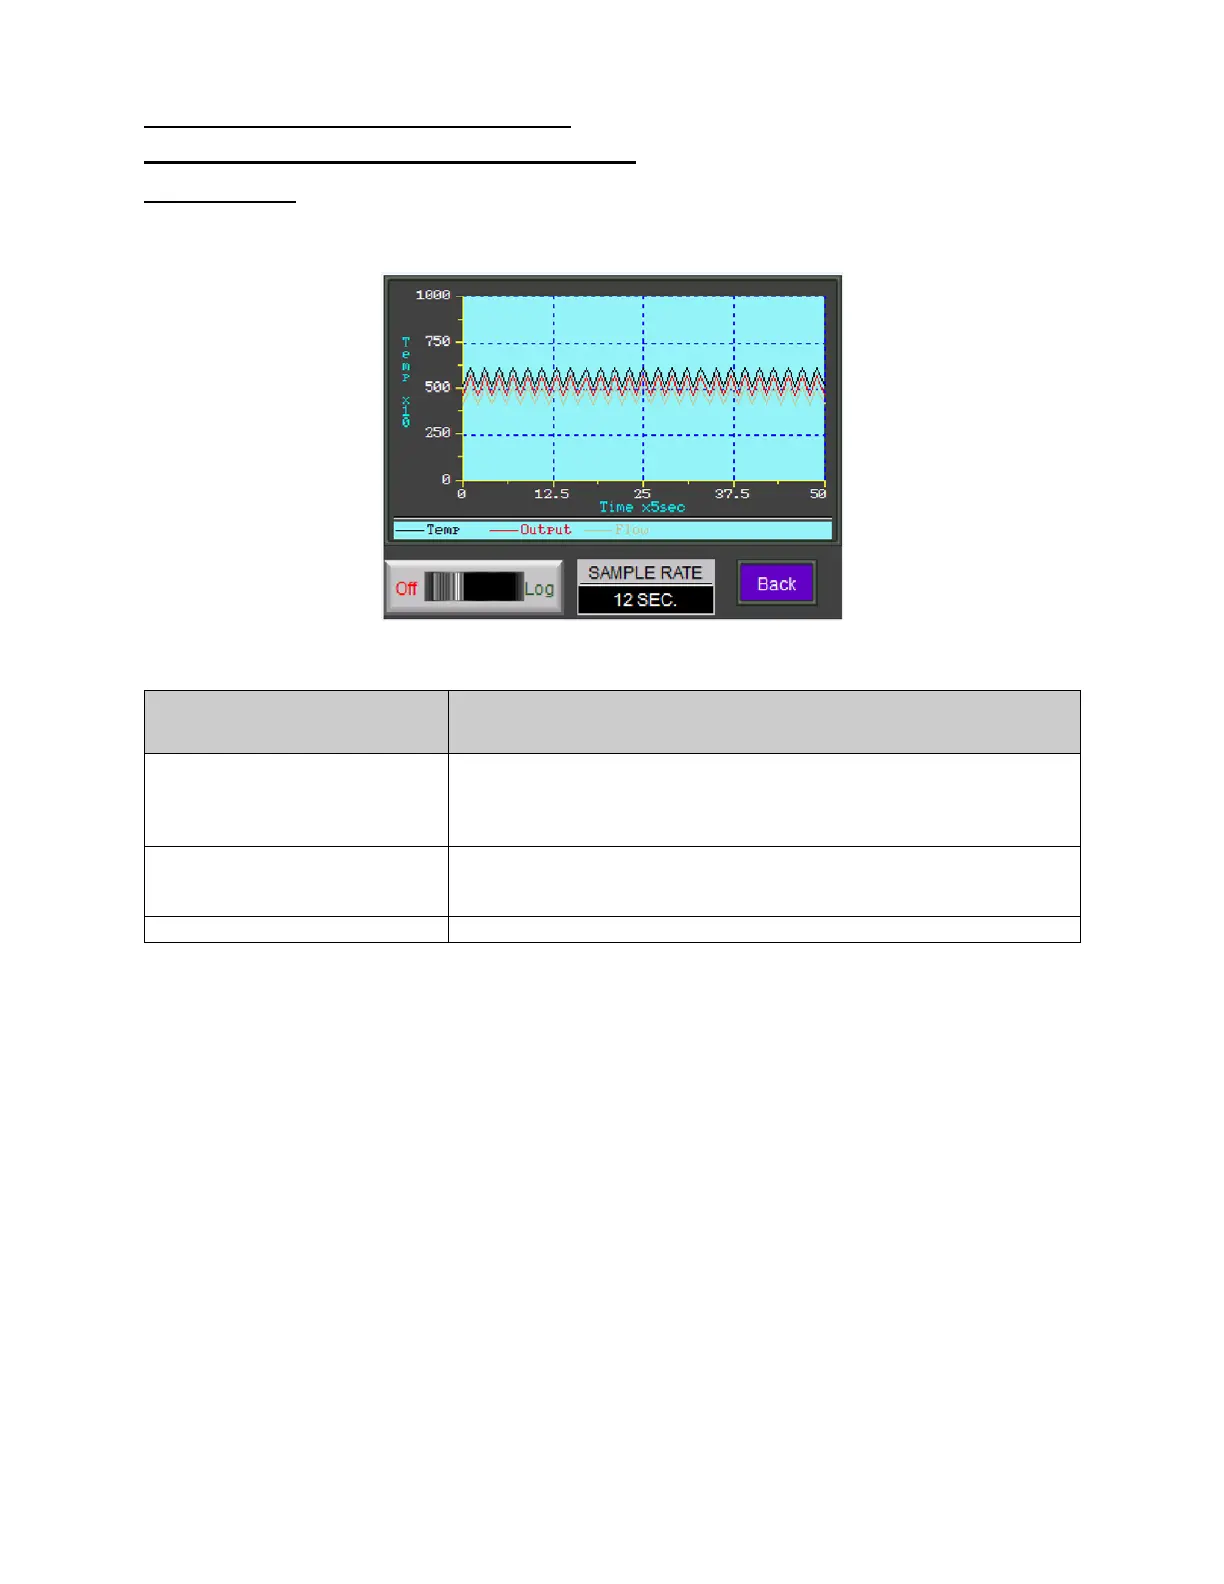
Trend Graph:
The TREND GRAPH displays the graph of current datalog values. This display includes the fields to
adjust the sampling rate and the switch to stop or start datalogging.
Figure 10: Trend Graph
Trend Graph Information
Description
OFF- LOG
This button turns on or off the data logging function. When off is
selected, there is no trend graph data to view.
Pressing the LOG side of this button will activate the data logging
function and will then display the trend graph lines.
SAMPLE RATE
This field displays the sampling rate for the trend graph. Press this
button to bring up a keypad to change the sampling rate. The range
for data sampling is 2-60 seconds.
This button will return to the previous screen.