Page | 44
9.3 DATA TRANSFER AND VISUALIZATION
1. Once kinetic protocols data (OJIP, NPQ, LC) have been collected with the FluorPen to visualize the data it needs to be downloaded
to the PC first via FluorPen software. Before data transfer can occur a successful connection between the FluorPen and the PC
needs to be established via USB cable or Bluetooth module (see chapter 7 and 8 for details).
2. Click the Download icon or select Device > Download.
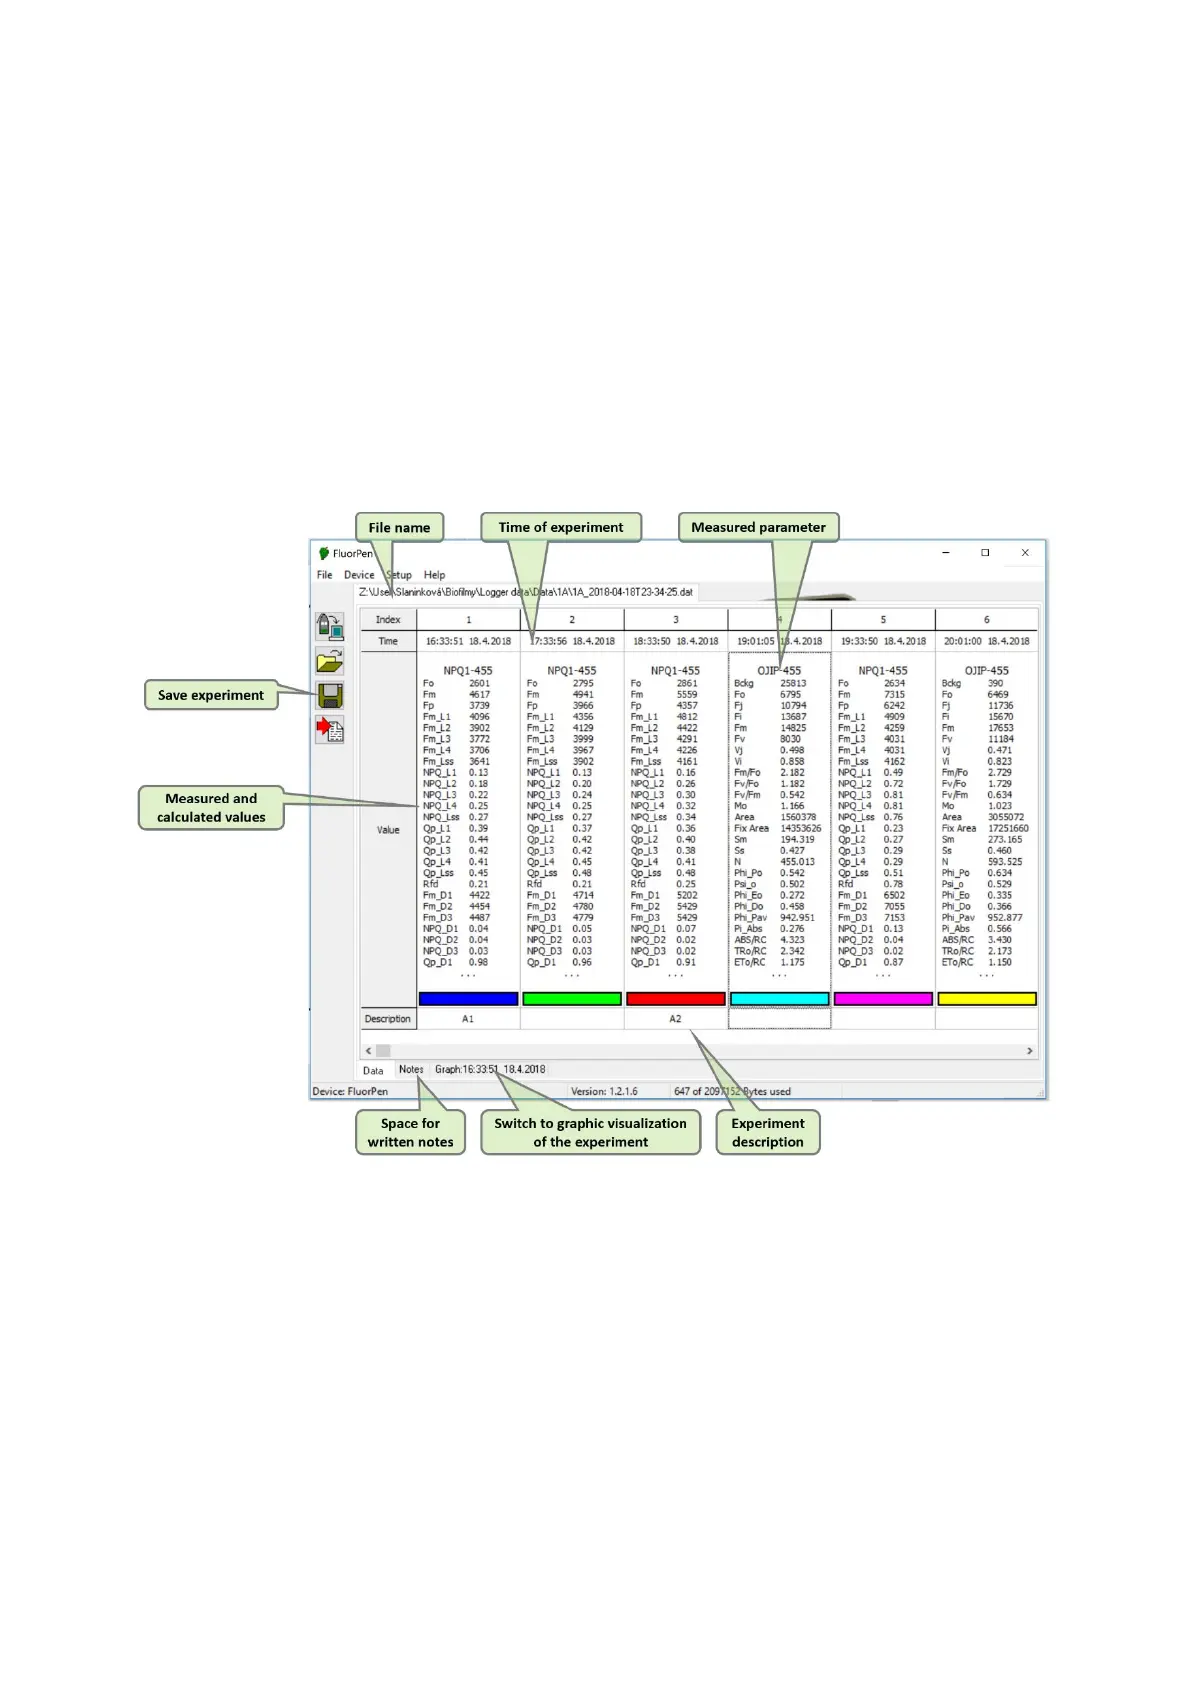
3. Once the download is complete the Data can be visualized in a table shown below (Fig. 26).
Fig. 26 Example of data transfer and visualization.
4. To visualize the data in the graph mode, click the Graph field in the bottom bar.
5. The selected set of data will be shown on the Graph ( Fig. 27).
 Loading...