26. February 2024 © Copyright 2024, PROCEQ SA 24
5.2 B-scan
B-scans are a pictorial representation of the A-scans of several measurements taken along a
measuring line, as a section through the component perpendicular to the surface. The
amplitudes of the A-scans are coded in color scales.
B-scans provide a cross-sectional image of the test object perpendicular to the scanning
surface in the plane through which the individual A-scans have been collected. The width of
the B-scan corresponds to the width of the aperture, i.e., width = (number of channels-1) x 3
cm.
The PD8050 is an 8-channel transducer. One channel transmits and the echoes are received
by the other seven channels. Each channel transmits in turn.
A complete cycle consists of 28 individual A-scans. These are used to create a B-scan which
is displayed in real time on the measurement screen. This is extremely useful for carrying out
quick spot checks at any point of the structure without the need to save any data. Once areas
of interest have been located, more extensive scans can be made.
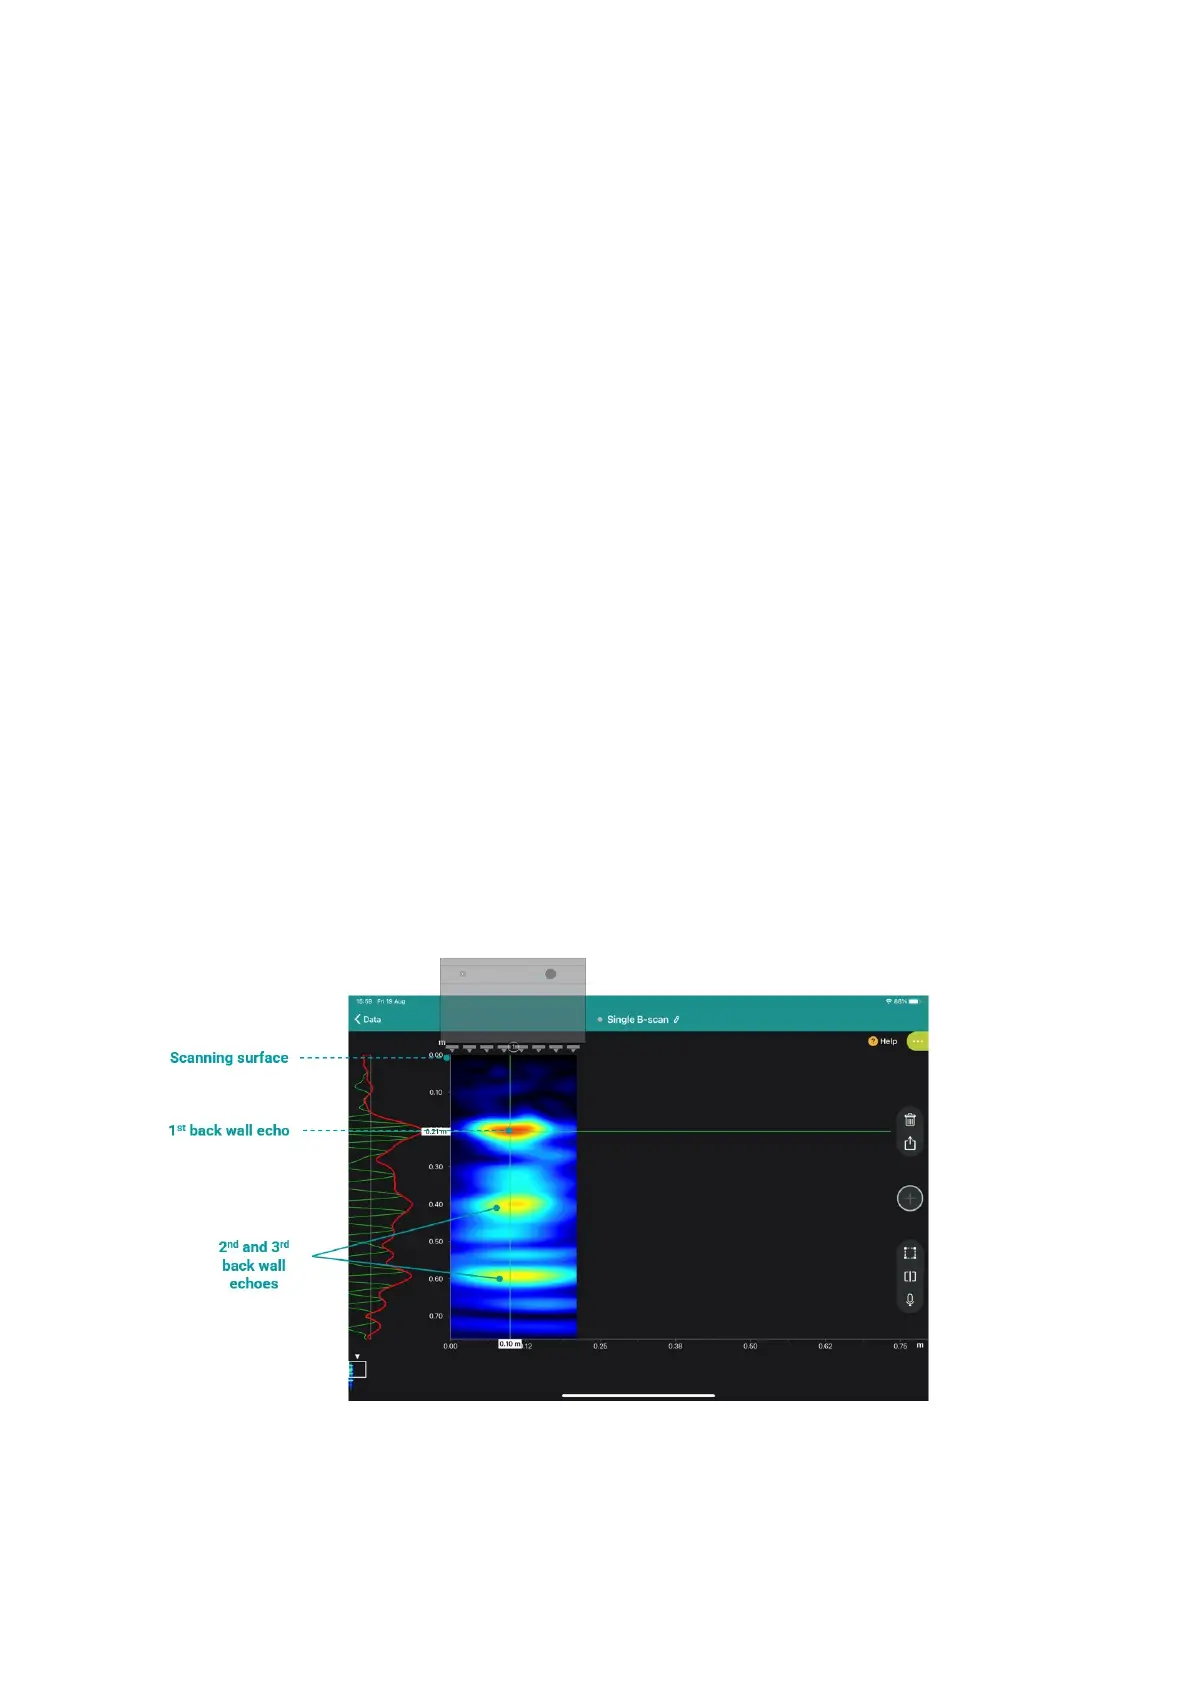
The cursor can be dragged to any point on the B-scan and the corresponding A-scan will be
displayed in the left-hand window. As the cursor is moved around the B-scan, the left-hand
scale shows the depth at which the cursor is located. The bottom scale shows the cursor
position relative to the left-hand side of the transducer and the left-hand scale shows the
transmission time in the A-scan view.
Correct depth indication depends on the accuracy of the pulse velocity setting. The pulse
velocity can be entered manually if known, or it can be estimated automatically as described
in the following chapters. Correct identification of the backwall echo is assisted by analysis of
the A-scan and is described in the following chapters. The B-scan can be optimized in real-
time also by adjusting the gain and the time gain compensation using the controls on the
transducer as described in the following chapters.
Figure 18: Understanding echoes with B-scan.