26. February 2024 © Copyright 2024, PROCEQ SA 53
By interpolating consecutive B-scans, a 3D image is then created.
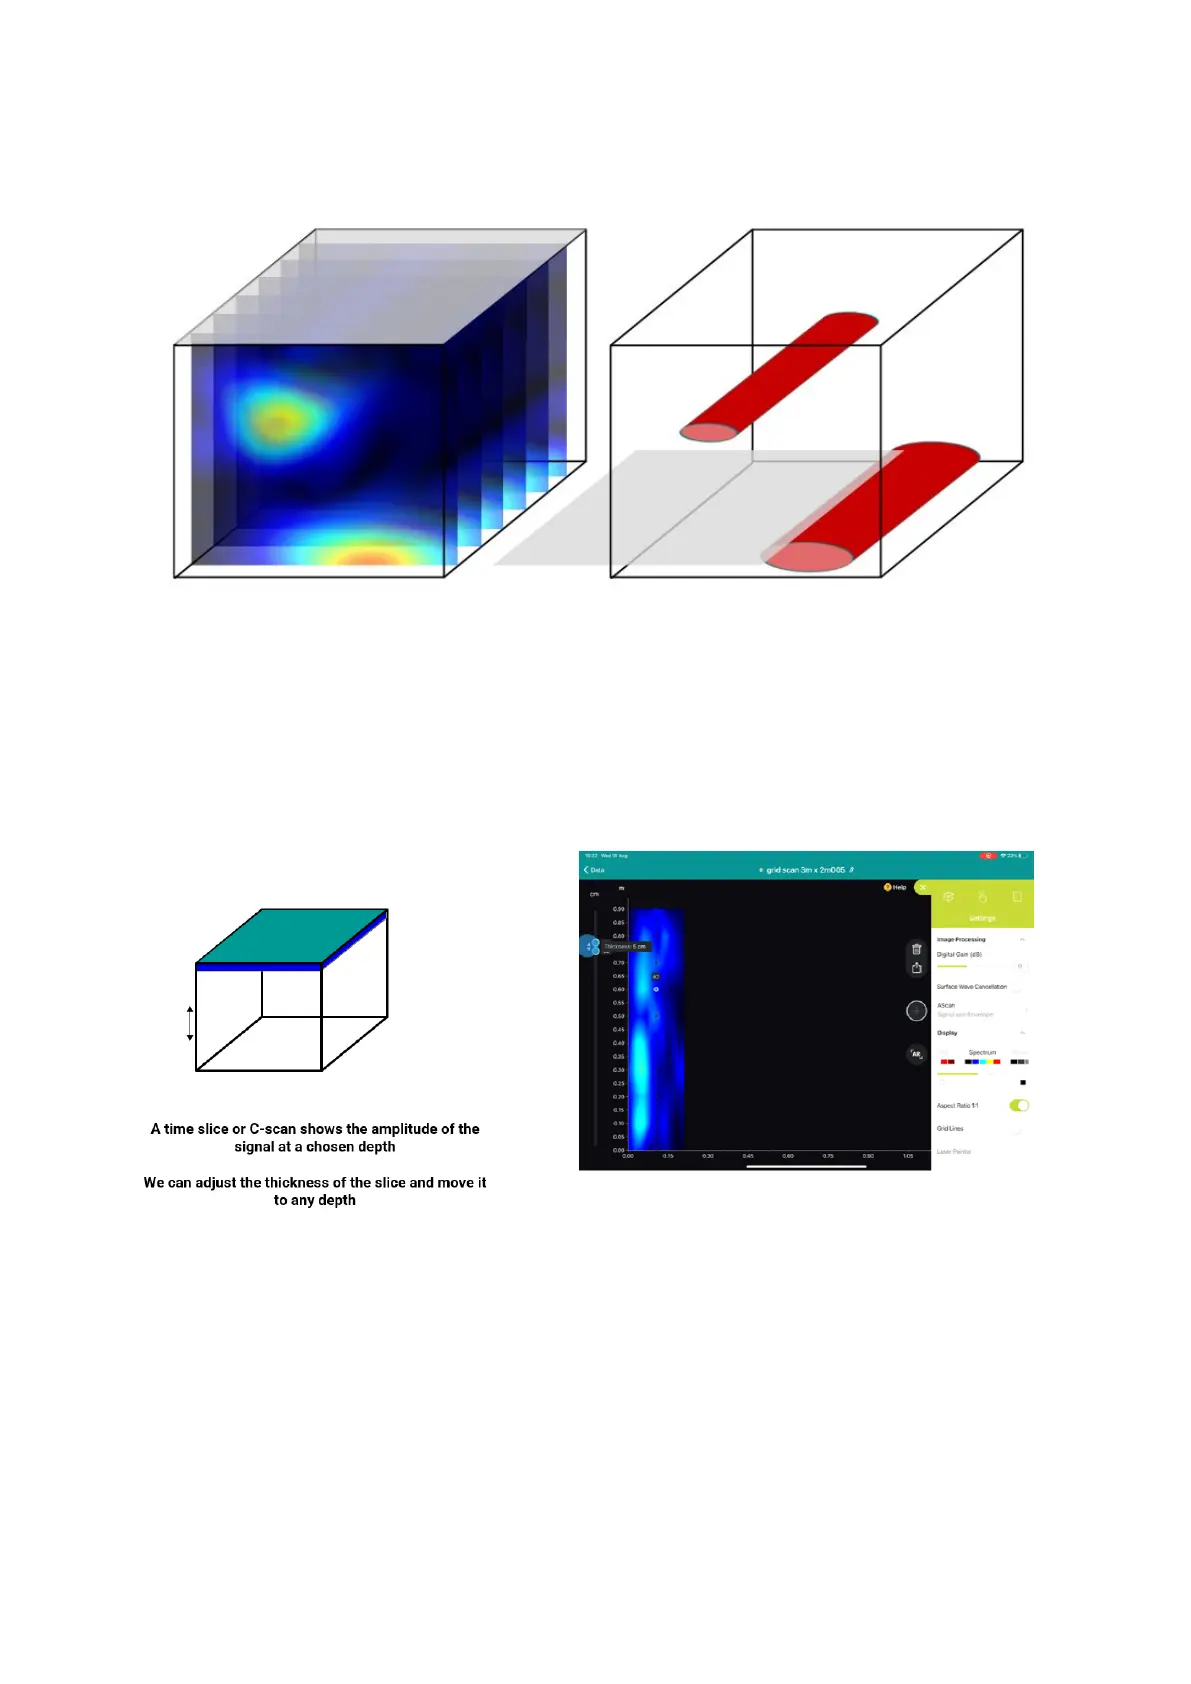
Figure 58: Full 3D matrix scan.
This 3D view can be sliced to see what is called the “Time Slice” or C-scan. It shows the
amplitude of the signal at a chosen depth. We can adjust the thickness of the slice and move
it to any depth.
Figure 59: C-scan view.