EAGLE™
User Manual
If you hover the cursor over the graph, a box will pop up with the detailed info for the
data point at that spot on the graph.
You can zoom in to an area on the graph by clicking on a spot and dragging the mouse.
This will show a highlighted area, which will rescale the x-axis to fill the graph when you
let go of the mouse button.
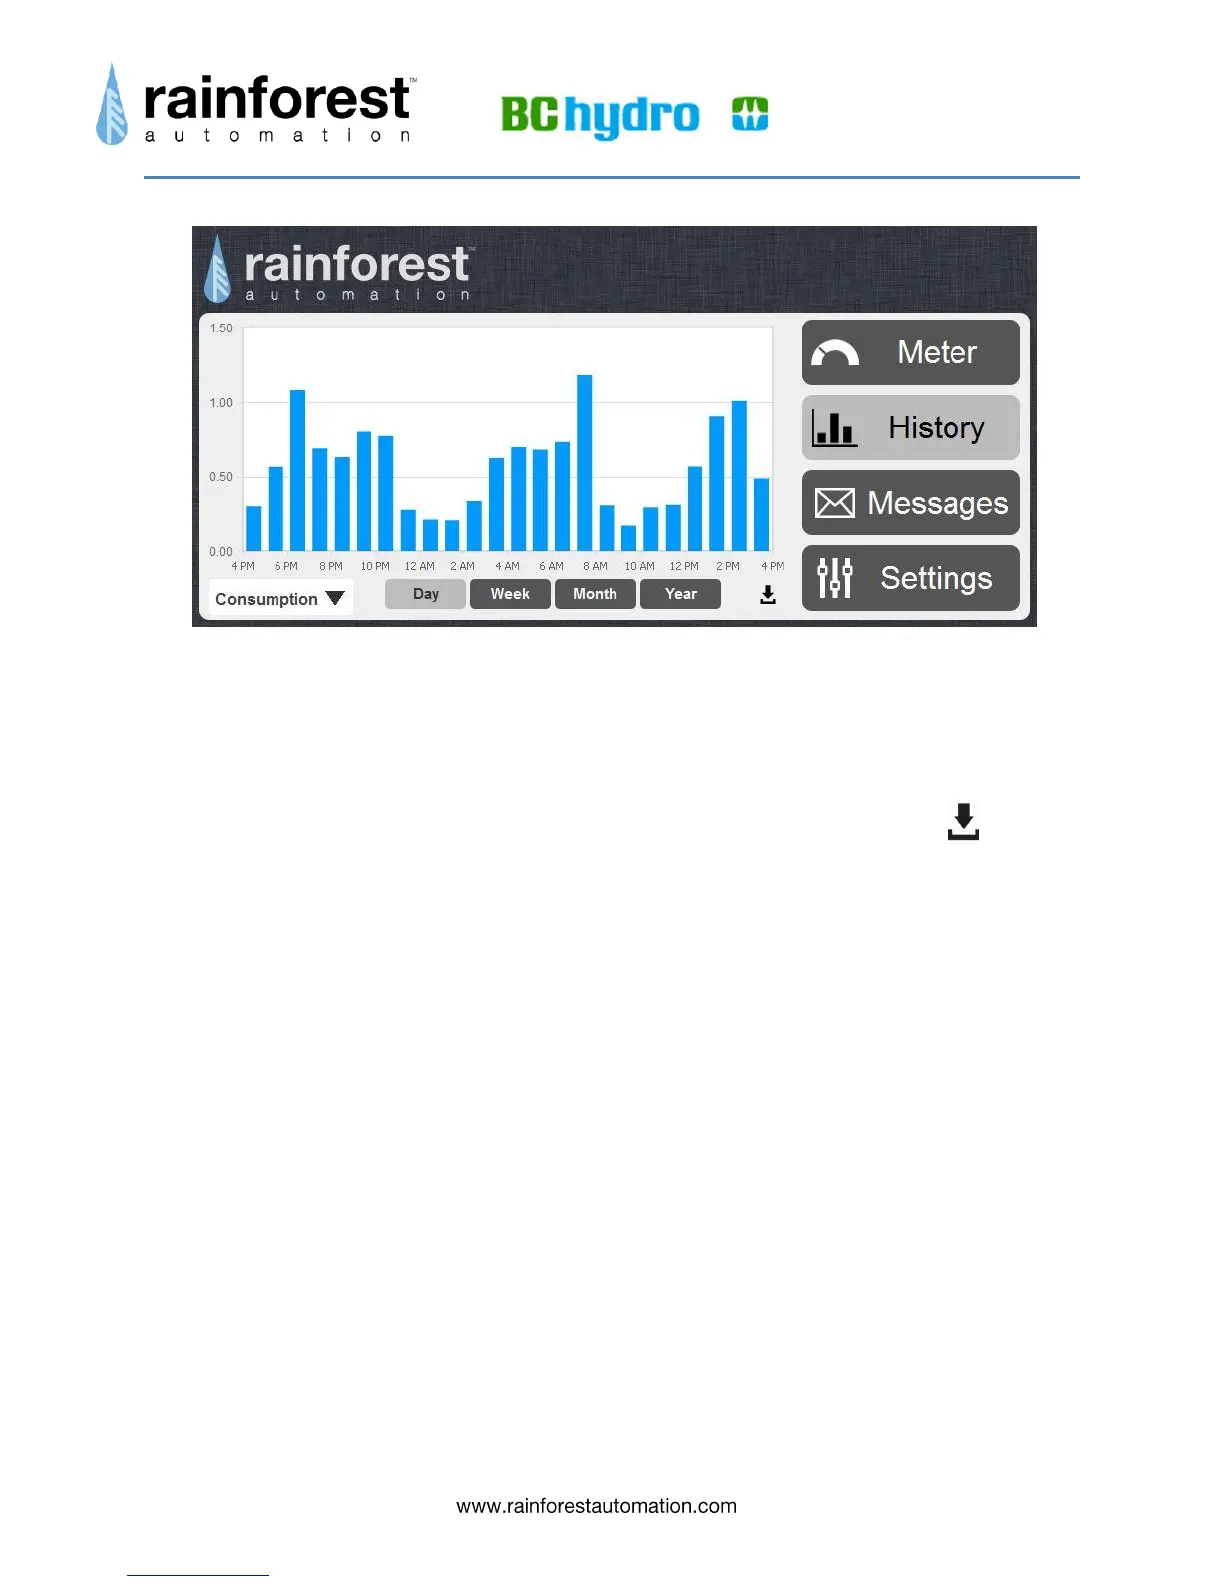
Beneath the bottom right hand corner of the graph is the download symbol:
Click this to download the raw data from the EAGLE™ database for the time period of
the current graph. The data will be in a CSV file, which can be opened with a
spreadsheet program.