54
Mobile Band bar graphs are more than a simple power graph. To view the spectrum behind a given bar
tap on a bar graph. The spectrum is displayed with a span that covers the selected graph. Green vertical
dashed lines represent the boundaries of the bar graph that was selected.
In the spectrum display, the normal functions are available such as peak, persistence, signal lists, etc.
Pressing Zoom In will reduce the frequency span. Pressing Zoom Out will increase the
frequency span. Zooming out beyond the bar graph frequency limits will return to the bar graph screen.
Discrete Bands
It is possible to display the spectrums of all the bar graphs simultaneously. To do so, press the “Discrete
Spectrums” button in the top right area of the screen.
This allows focus on the spectrum of select bands rather than the entire 6GHz frequency range. This
feature may be more useful if only the bands that desired to be monitored are enabled (see the next
section “Editing Mobile Bands” to learn about enabling/disabling select bands.)
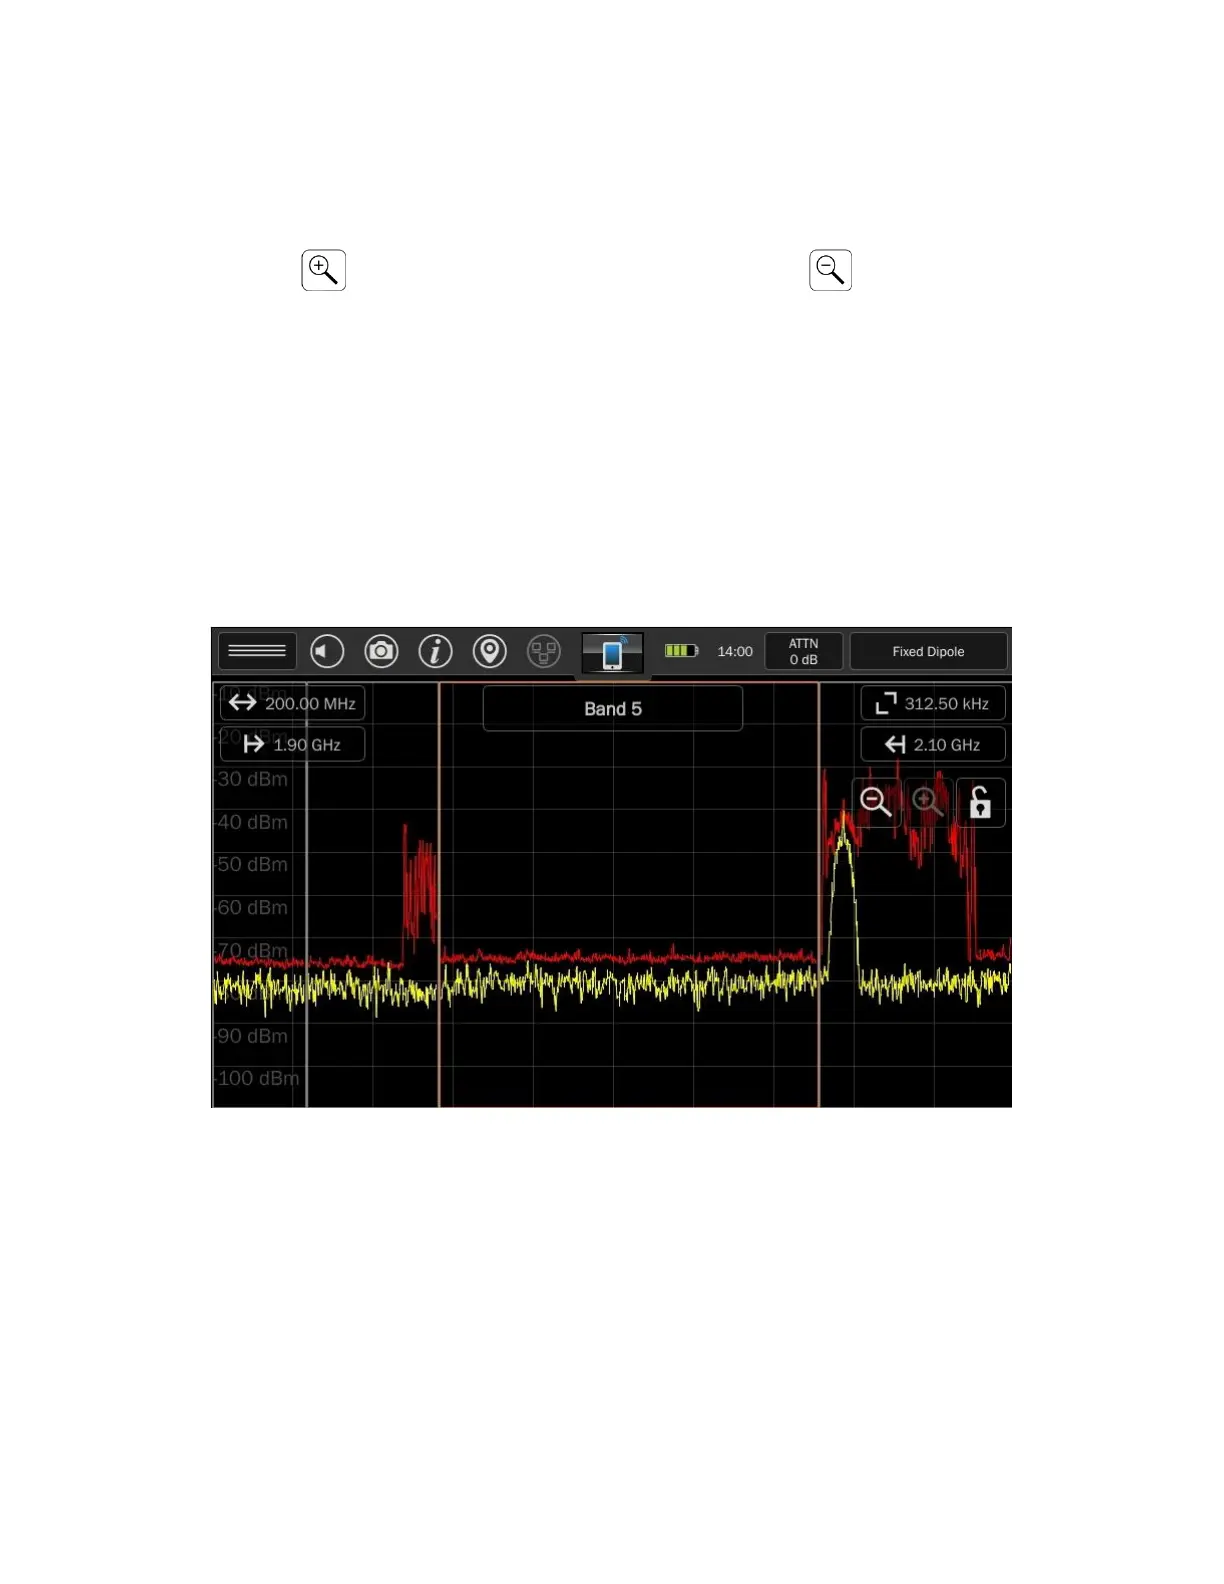
Tap any of the discrete bands to select it. The selected band will be highlighted with an orange border.
The spectrum indicators at the top of the screen (span, start frequency, stop frequency) will change to
reflect the correct values for the selected band. The name of the selected band will be displayed at the
top center of the screen.
Tap any selected band a second time to view the spectrum for just that single band. Green vertical
dashed lines represent the boundaries of the bar graph that was selected. In the spectrum display, the
normal functions are available such as peak, persistence, signal lists, etc.
 Loading...