53
Signal List
This option toggles the display of the signal list window on the bottom half of the screen.
If no signal list is currently open in memory, the signal list window will be empty.
For additional details on the signal list window, see page 81.
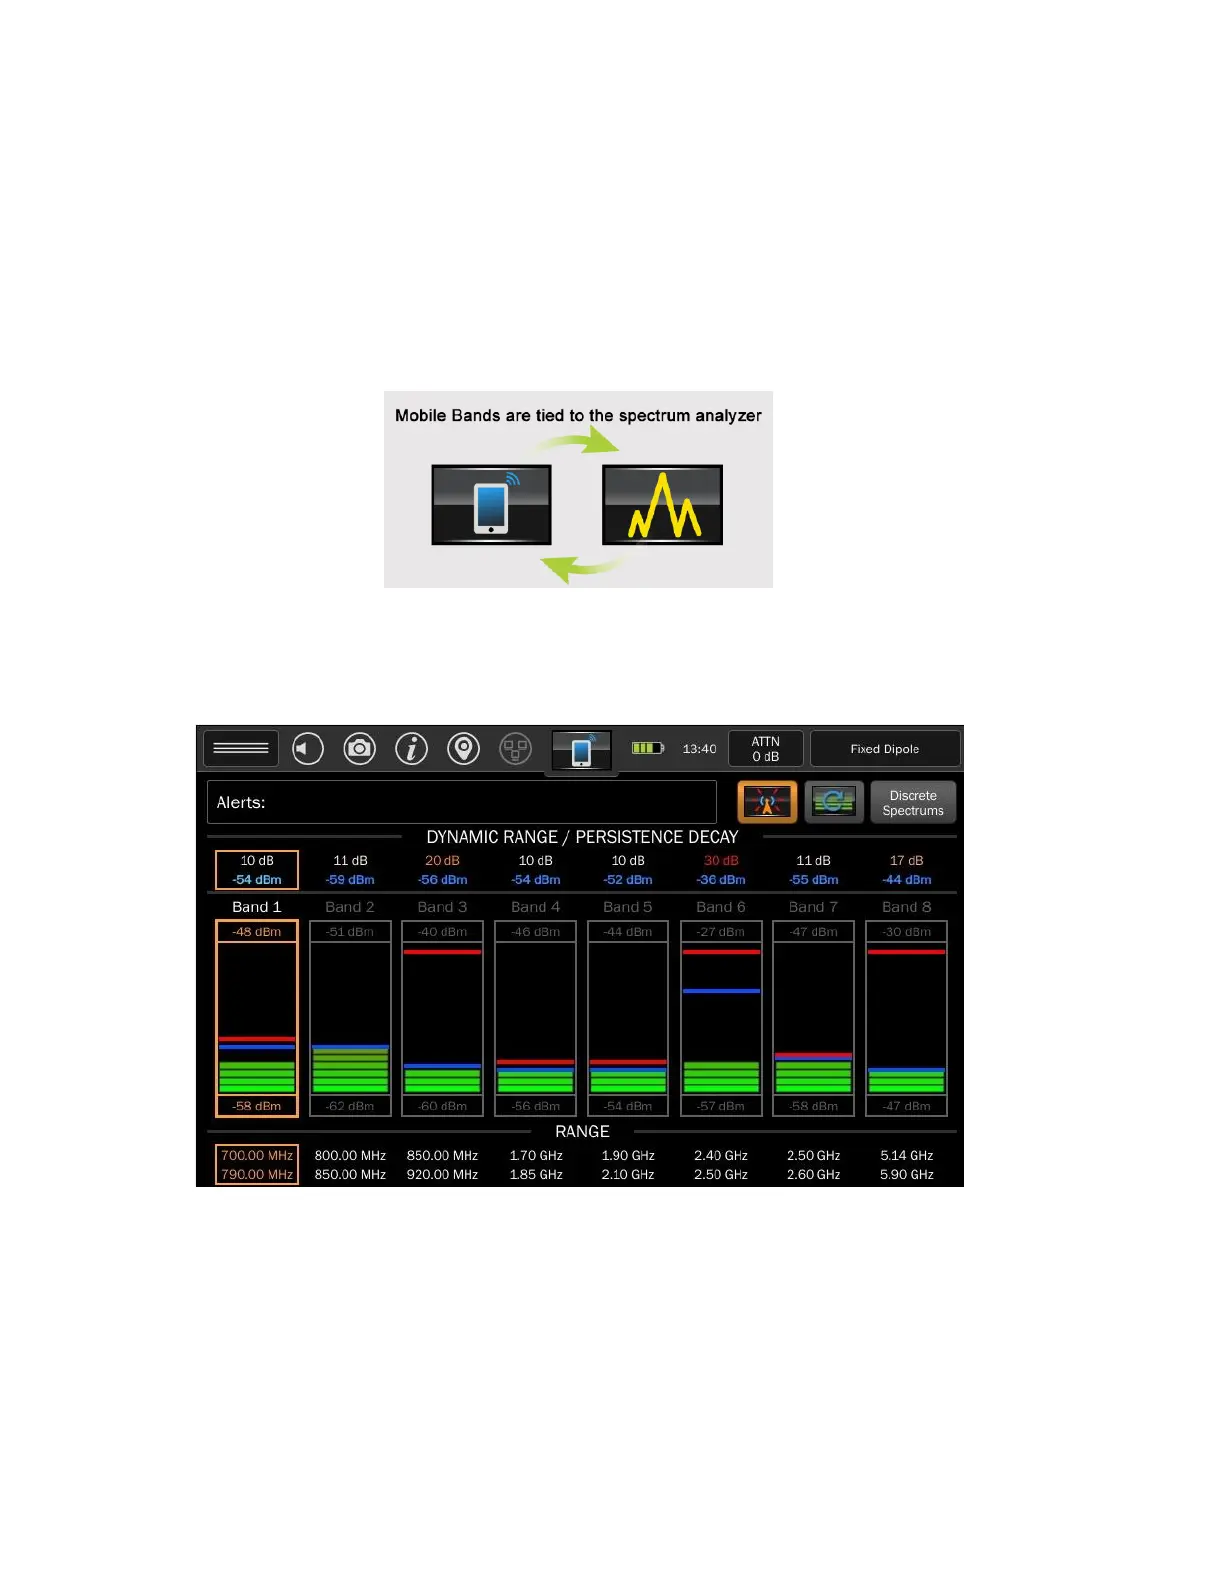
Mobile Bands
Mobile bands mode displays up to 8 bar graphs at once. Each bar graph displays power within a
specified band. In this mode, the spectrum data is presented as if there are multiple bandpass-filtered
power detectors working in tandem.
Each bar graph represents the power within a specified frequency band and there is an associated min,
max, peak, and persistent power shown. Above the bars is an associated number for dynamic range
(equal to P
max
–P
min
) and persistent power (moving average). Above and below the bar graph shows the
min and max powers. Within each bar graph, the blue and red bars indicate the persistent and peak
powers respectively. The frequency range is displayed below the bar.
 Loading...