74
Occasionally an Access Point, when handling large amounts of data, will create an additional
virtual device. This “device” may be identified by the MESA 2.0 as a Client. Physically, it will be
the same device as the original AP that created it. In conclusion: Allowing the MESA to scan for a
few minutes will better classify found devices. Physically finding the device before analyzing its
AP/Client connections is a good practice.
4) RSSI Bar Graph
The Bar Graph in the bottom right of the Detail View screen displays the RSSI data for the
device. The Bar Graph displays a range of -30 to -80 dBm. Above the Bar Graph box, the power
of the selected device is displayed. If the number is green, the device is currently and actively
transmitting at this power level. If the number is yellow, it is the latest RSSI value detected but
the device is not currently transmitting. Note: If the MESA has been moved out of range of the
selected device, there may not be any RSSI data. Additionally, if the MAC address for the device
has rolled due to MAC randomization, there may not be any RSSI data.
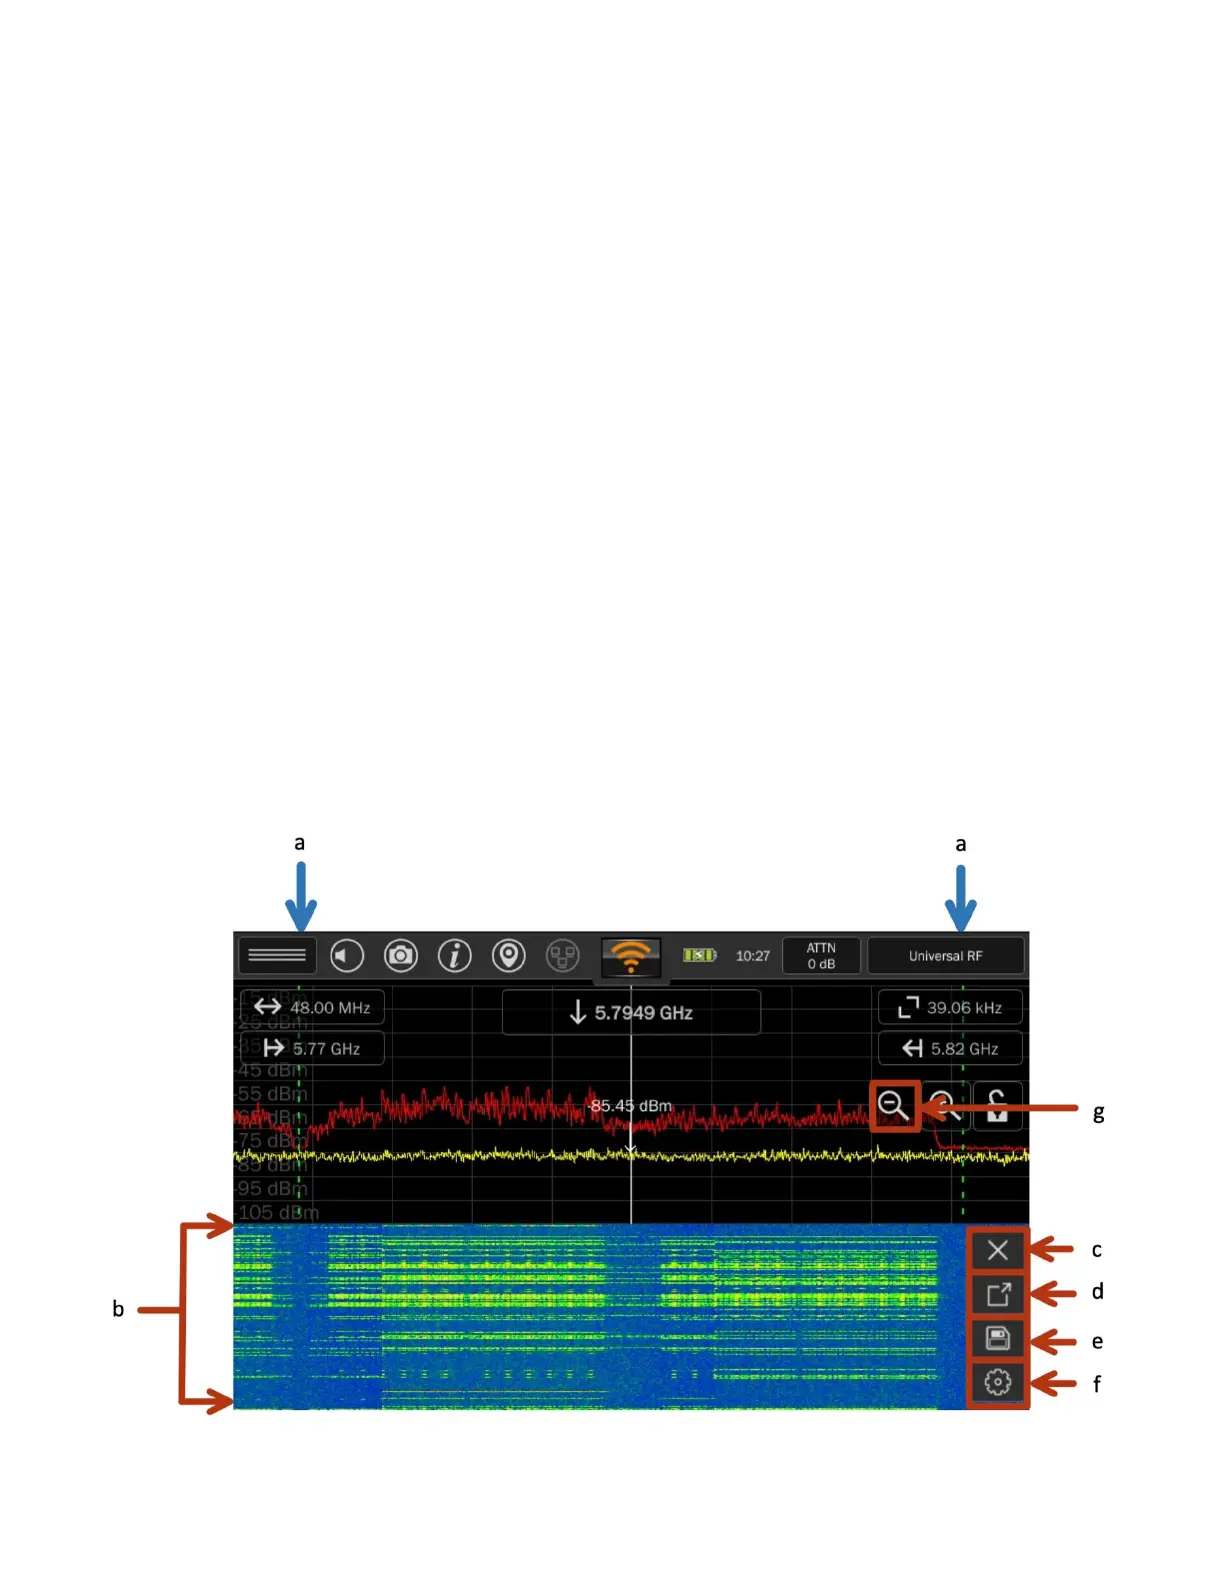
5) View Spectrum
To view the spectrum for the device: From the Detail View screen, press the “View Spectrum”
button located near the top right of the screen. The MESA 2.0 will begin displaying the RF
Spectrum and Waterfall view for the selected device/network. While in spectrum view, the span
is limited to the detected channels’ frequency, but the normal options are available (peak,
average, persistence, etc.)
 Loading...