INTEGRA-X User Manual WEB GUI
SAF Tehnika JSC 63
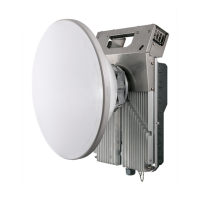
Performance Over The Air Equalizer graph
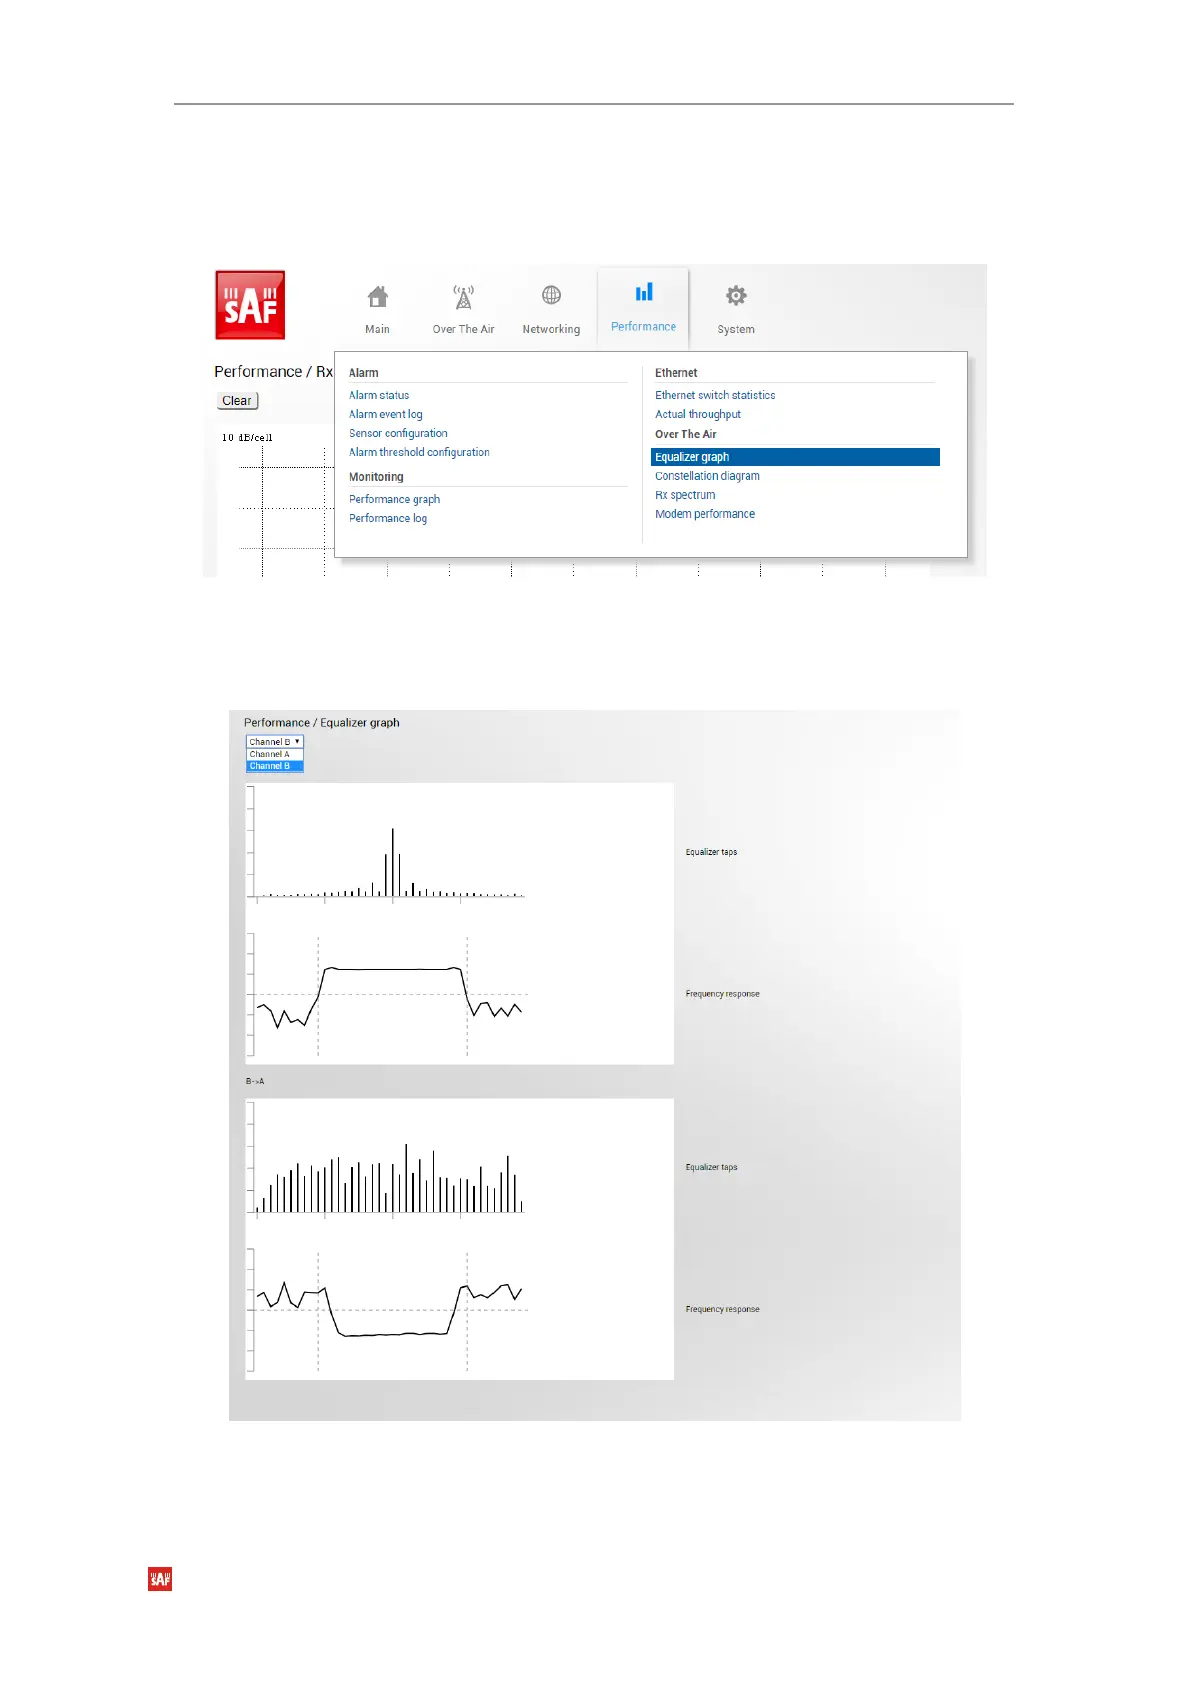
The Equalizer graph window shows adaptive equalizer ‘taps’ coefficients, which at a set time
moment minimize multipath fading effect in the channel. For more details see chapter
“
Adaptive equalizer”
.
Figure 3-58 Accessing Equalizer graph
MODIFY button is deactivated in Equalizer graph page.
Example of equalizer ‘taps’ coefficients and its frequency response in case of normal operation
is shown in
Figure 3-59
.
Figure 3-59 Equalizer taps and frequency response
You can choose between Channel A and Channel B graphs and see also cross discrimination
graph. During normal operation, the frequency response curve is smooth at the center and
 Loading...