INTEGRA-X User Manual WEB GUI
SAF Tehnika JSC 64
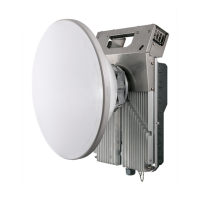
central equalizer tap is higher, while side towers evenly decrease. If equalizer taps and
frequency response curve significantly differ from the one above, it may be an indication of
multipath issues, which must be inspected with the use of precise and accurate path profiling.
Higher taps mainly on the right side indicate a weaker reflected signal compared to the main
signal, while higher taps mainly on the left side – stronger reflected signal.
Below is an example of Equalizer graph in a link aligned to the reflected signal, see
Figure 3-60
(for single polarization).
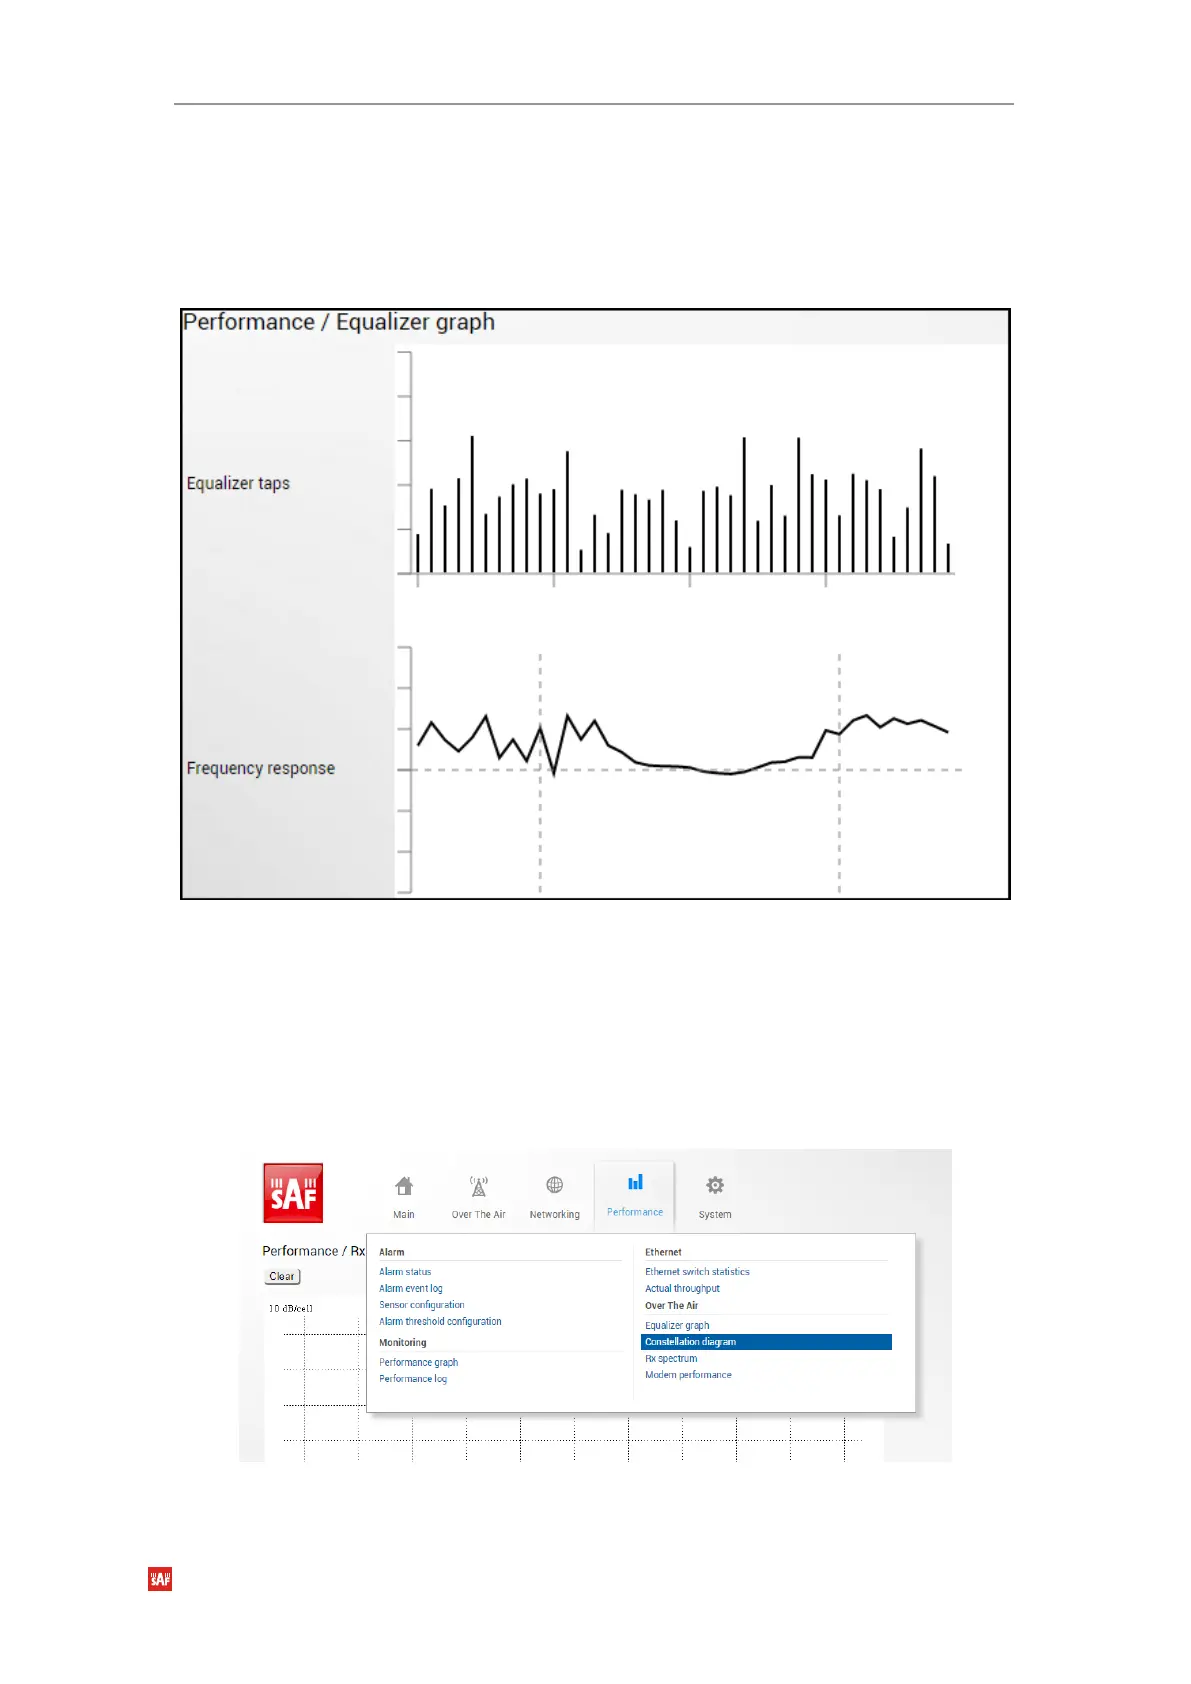
Performance Over The Air Constellation diagram
A constellation diagram is a representation of a signal modulated by the digital modulation
schemes 4096QAM, 2048QAM, 1024QAM, 512QAM, 256QAM, 128QAM, 64QAM, 32QAM,
16QAM, 4QAM. It displays the signal as a two-dimensional scatter diagram in the complex
plane at symbol sampling instants. A measured constellation diagram can be used to recognize
the type of interference and distortion in a signal.
Figure 3-61 Accessing Constellation diagram page
MODIFY button is deactivated in Constellation diagram page.
Figure 3-60 Equalizer graph for reflected signal
 Loading...