- View historical energy usage graph (kWh, $ and CO
2
)
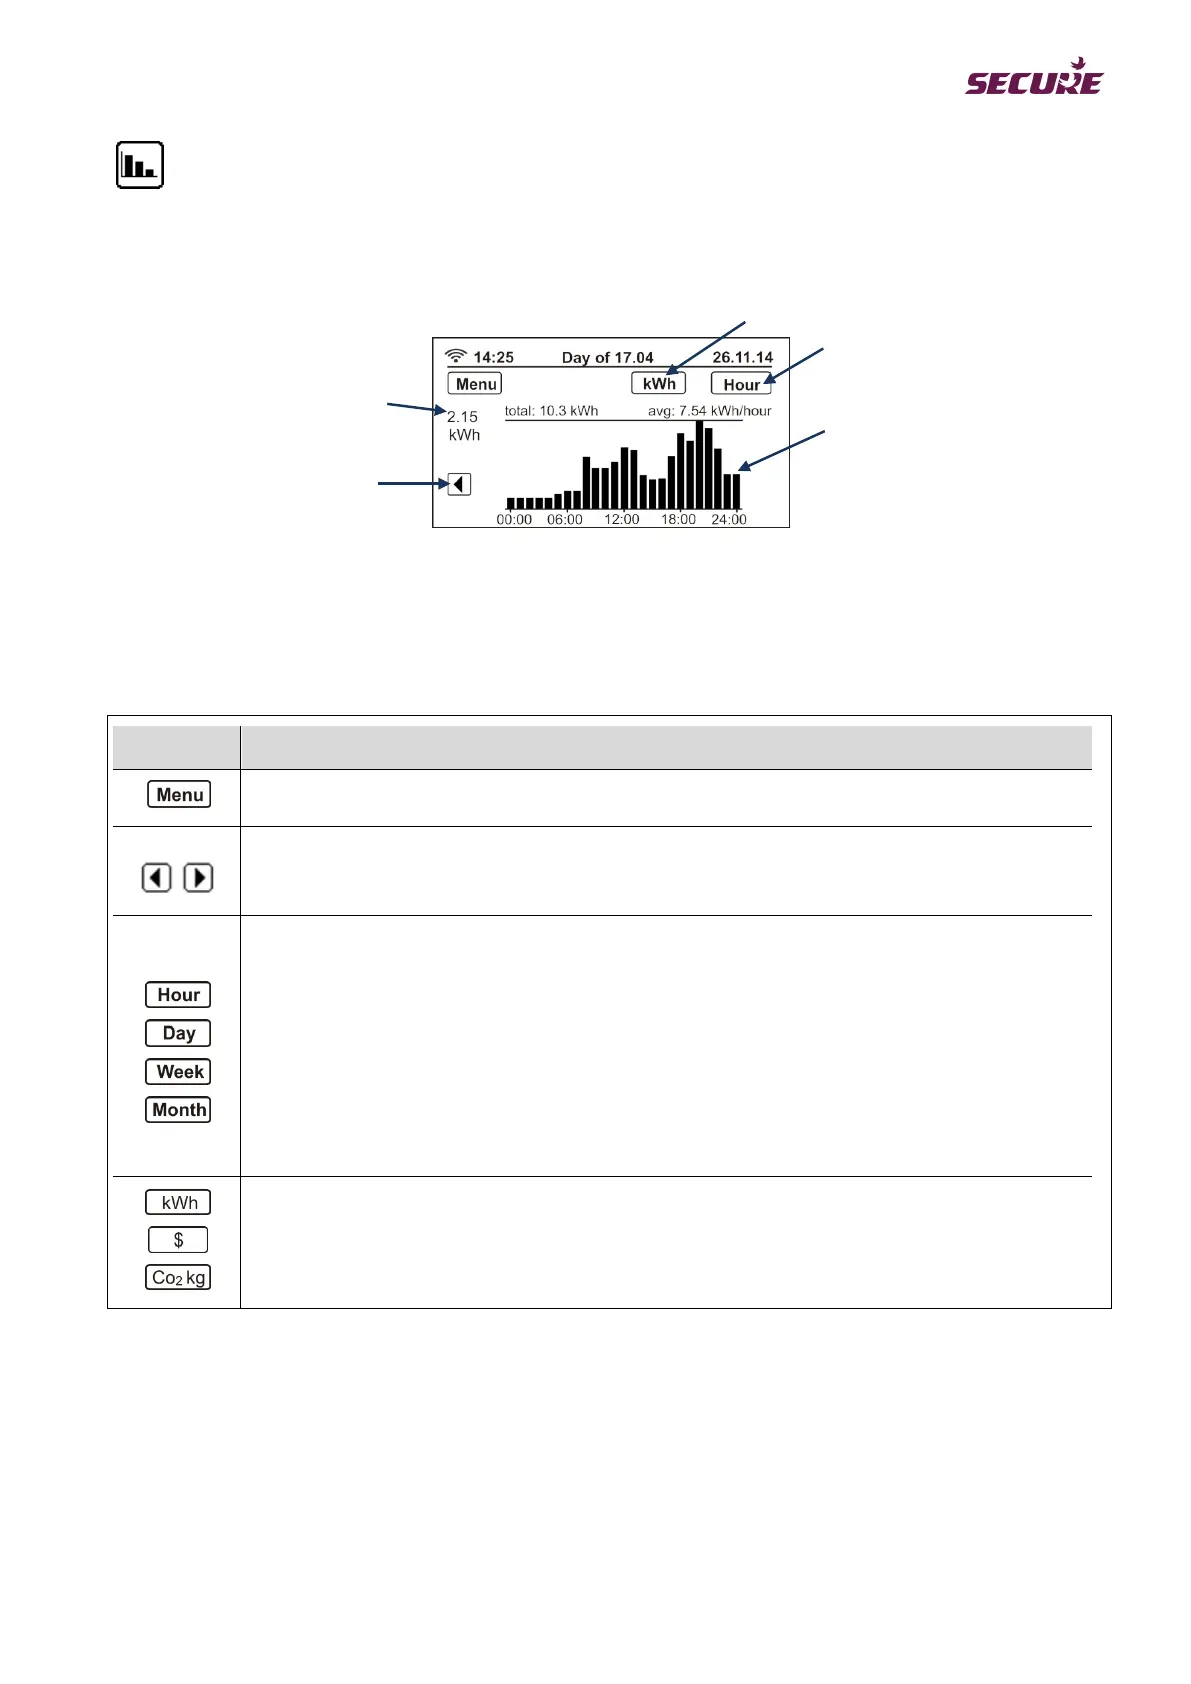
Press the Graphs icon to view the graph for net hourly electricity consumption pattern for a calendar day, as
shown in the following screen:
The left and right scroll buttons scroll backwards or forwards through the hourly consumption graph. Press the
View button to see daily, weekly and monthly consumption patterns graphically. Press the Unit selection button
to see the hourly consumption cost ($) and carbon emissions (CO
2
kg). The following table describes the
function of each button displayed in the above History screen:
Button Function
Menu button displays the main menu.
Scroll buttons located to the left and right of the bar graph navigate forwards or backwards
through the graph.
The View buttons select net hourly, daily, weekly or monthly energy consumption graphs; the
label on the button shows the type of information being displayed.
By default, the net hourly consumption bar graph for the current day is displayed; Day
accesses the net daily consumption bar graph for the most recent 45 days (including the
current day); Week accesses the net weekly consumption bar graph for the past eight weeks
(including the current week); Month accesses the net monthly consumption bar graph for the
past 13 calendar months (including the current month).
The Unit selection buttons access energy usage, cost or CO
2
information for the selected
View option. The label on the button shows the units of the information being displayed.
Table 4
Week and Month]
Unit selection button
[kWh, $, CO
2
]
for the period