Note: Press the Unit selection button to display the kWh, $ and CO
2
graphs.
- Compare energy usage history (kWh, $ and CO
2
)
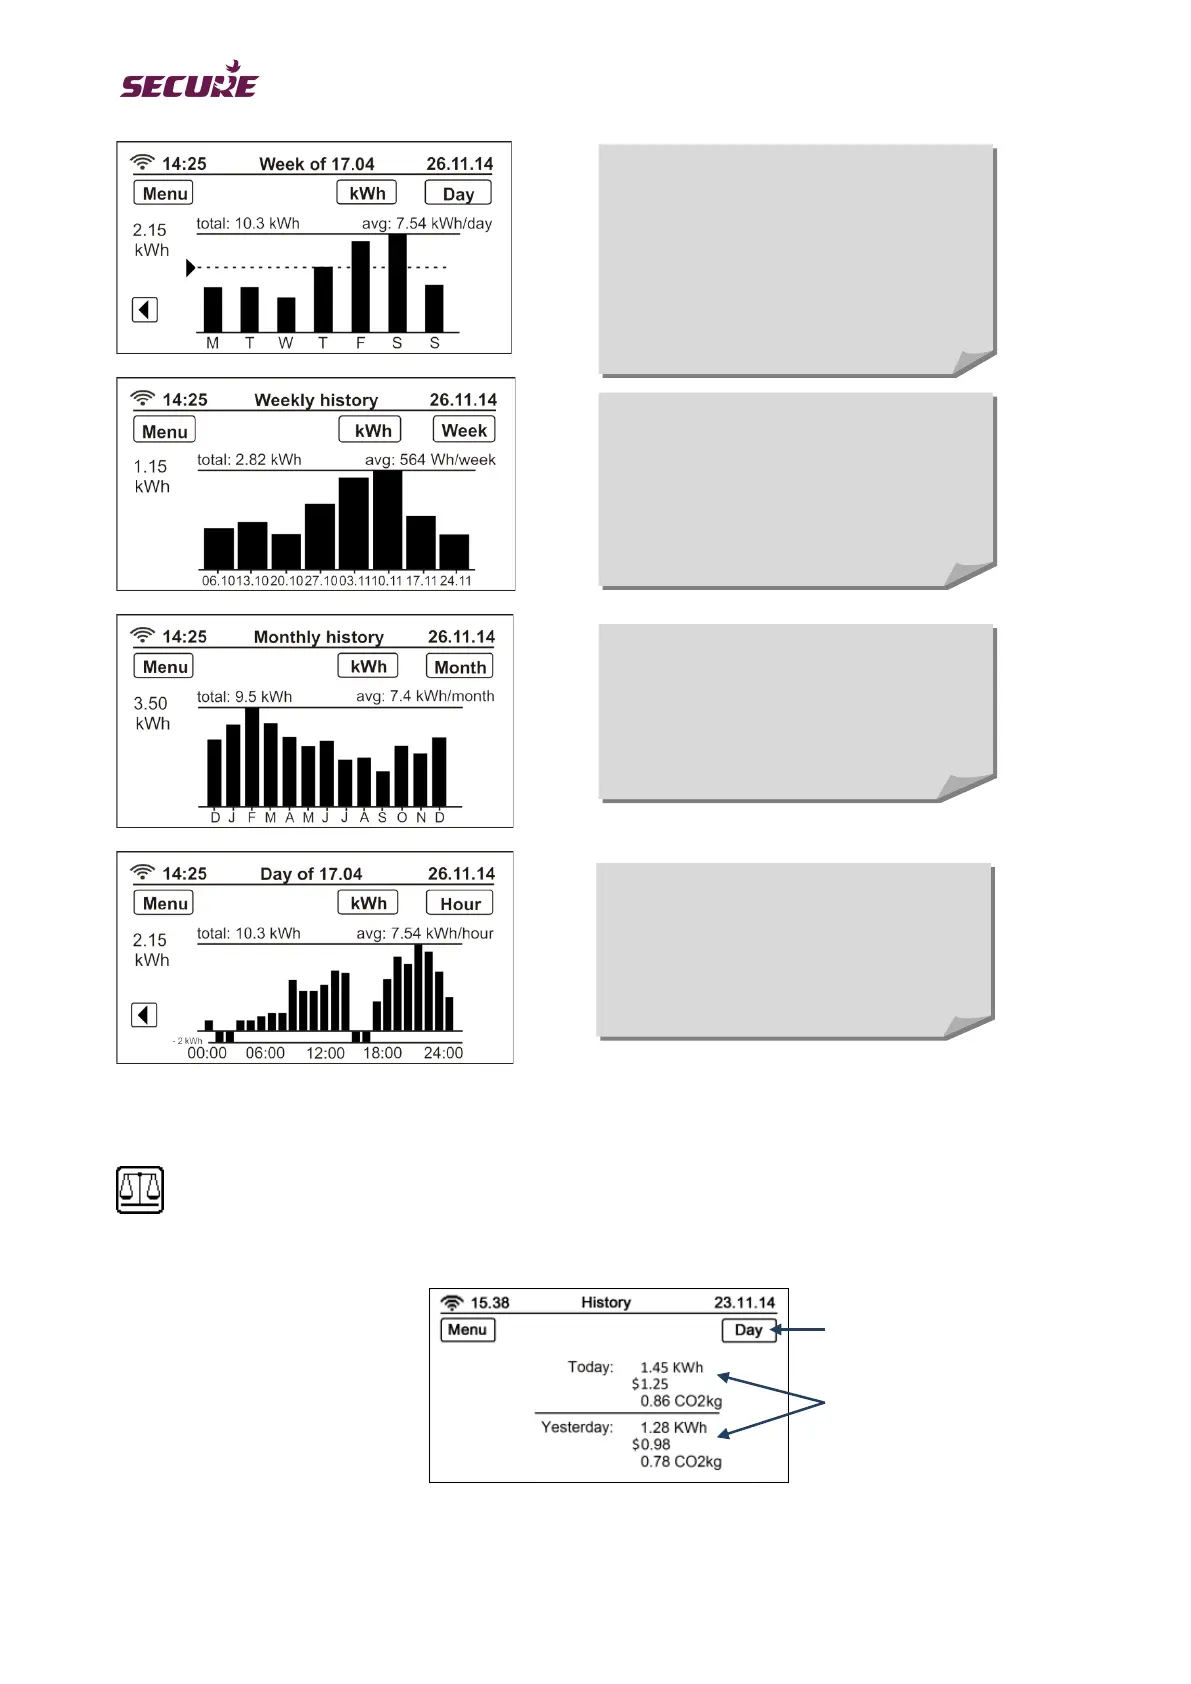
Touch the Compare icon to compare the energy consumption value by day, week, month or year.
Net daily consumption bar graph
Energy consumption graph for the past
45 days (including the current day).
Tapping on a bar will show the net hourly
consumption for that day.
Note: The arrow with dotted line shows
the daily consumption target.
Net weekly consumption bar graph
Net consumption graph for the current
week and the preceding seven weeks.
Tapping on a bar will show the net daily
consumption for that week.
Net monthly consumption bar graph
Graph for the past 12 calendar months,
plus the current month.
Net hourly energy consumption
Net hourly consumption graph for the
current day.
View button [Day, Week,
Month and Year]