Pressing the View button in the above History screen accesses the kWh, $ and CO
2
values for the current and
previous day/week/month/year.
- View historical energy usage table (kWh, $ and CO
2
)
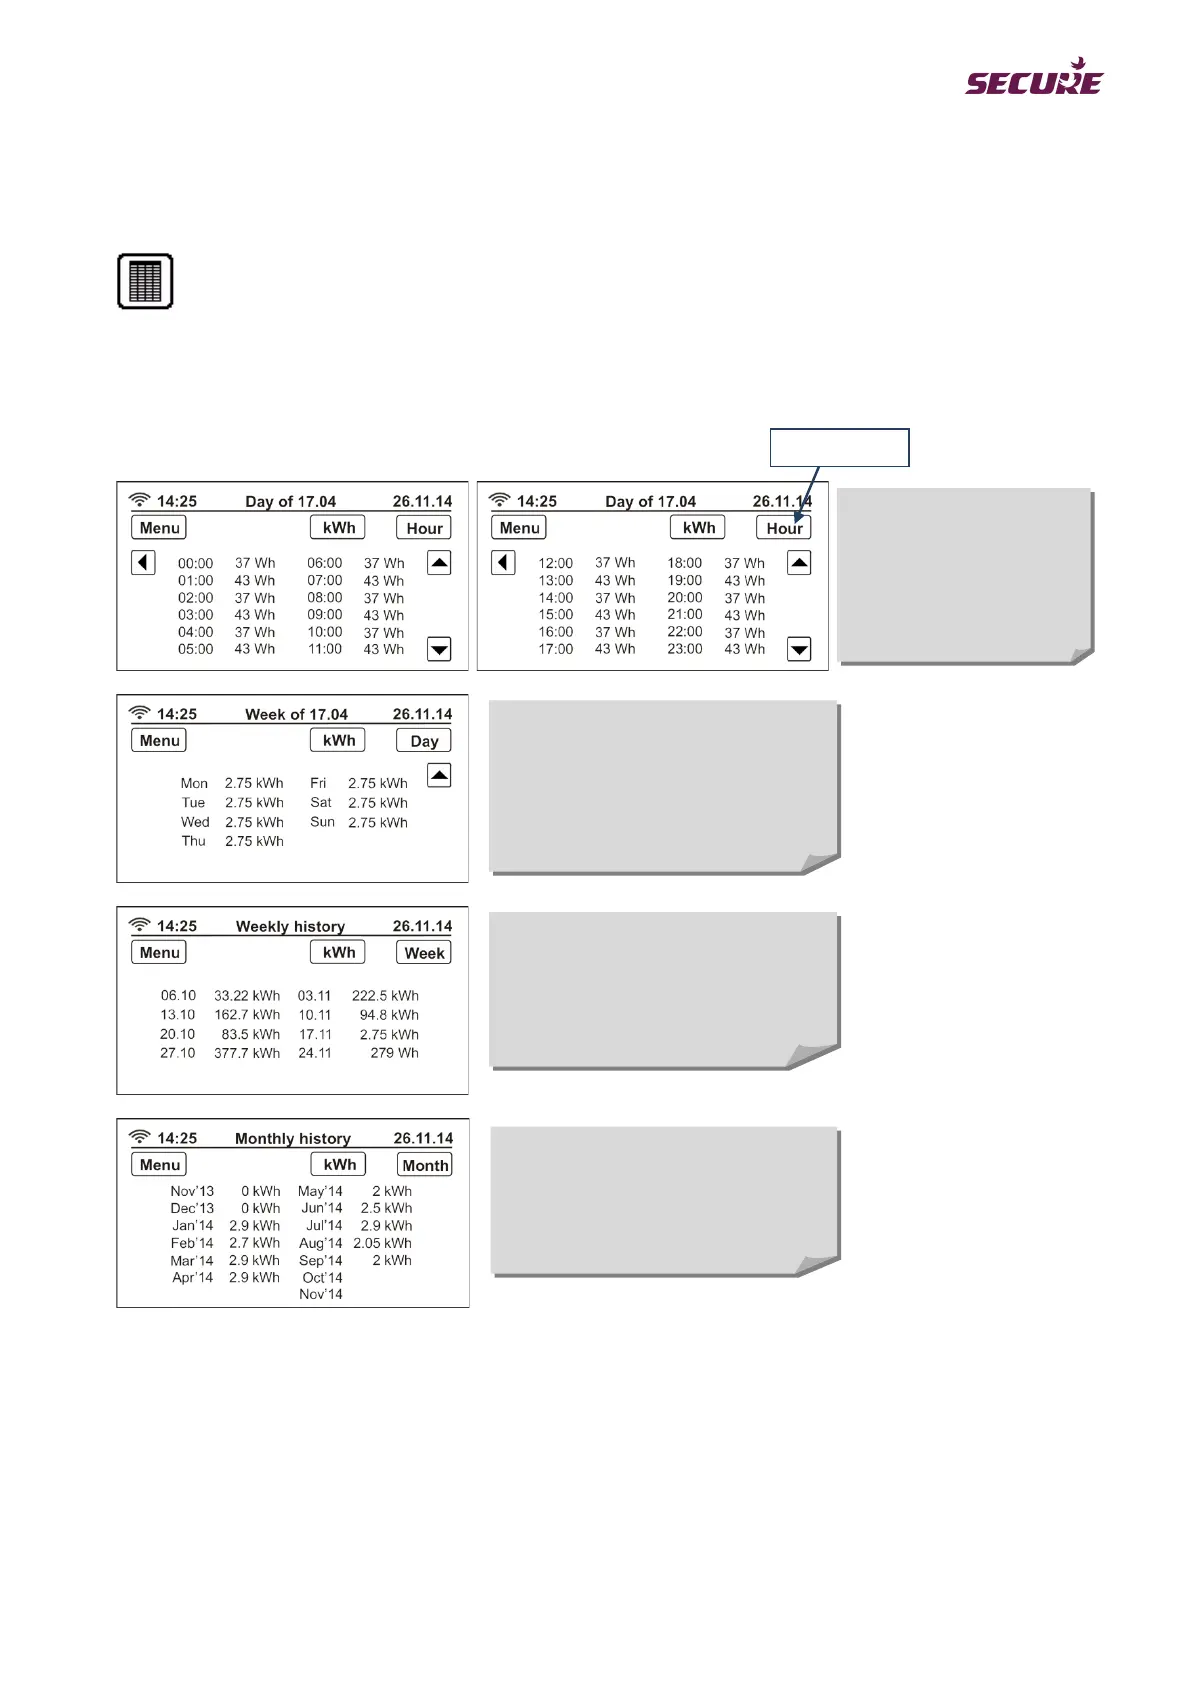
Touch the Table icon to view hourly electricity consumption pattern in tabular form. Use the Unit selection
button to cycle through the units (kWh, $ and CO
2
). Use the View button to display daily, weekly and monthly
data, as shown below:
Note: In this section, the term ‘consumption’ also refers to ‘generation’.
Daily consumption data table
Daily energy consumption values for
the past 45 days (including the current
day). Use the up and down arrows to
scroll through the data, a week at a
Hourly consumption data
table
Hourly energy consumption
values in tabular form. Use
the arrows to scroll through
the day or between days.
Weekly consumption data table
Weekly energy consumption values for
the current week and the past seven
weeks. The start date for each week is
Monthly consumption data table
Monthly energy consumption values for
the current month and the preceding 12
months.