MS 7000 | DIAVASO Datalogger User Manual | 05/05/2017
7.4.2 Graph
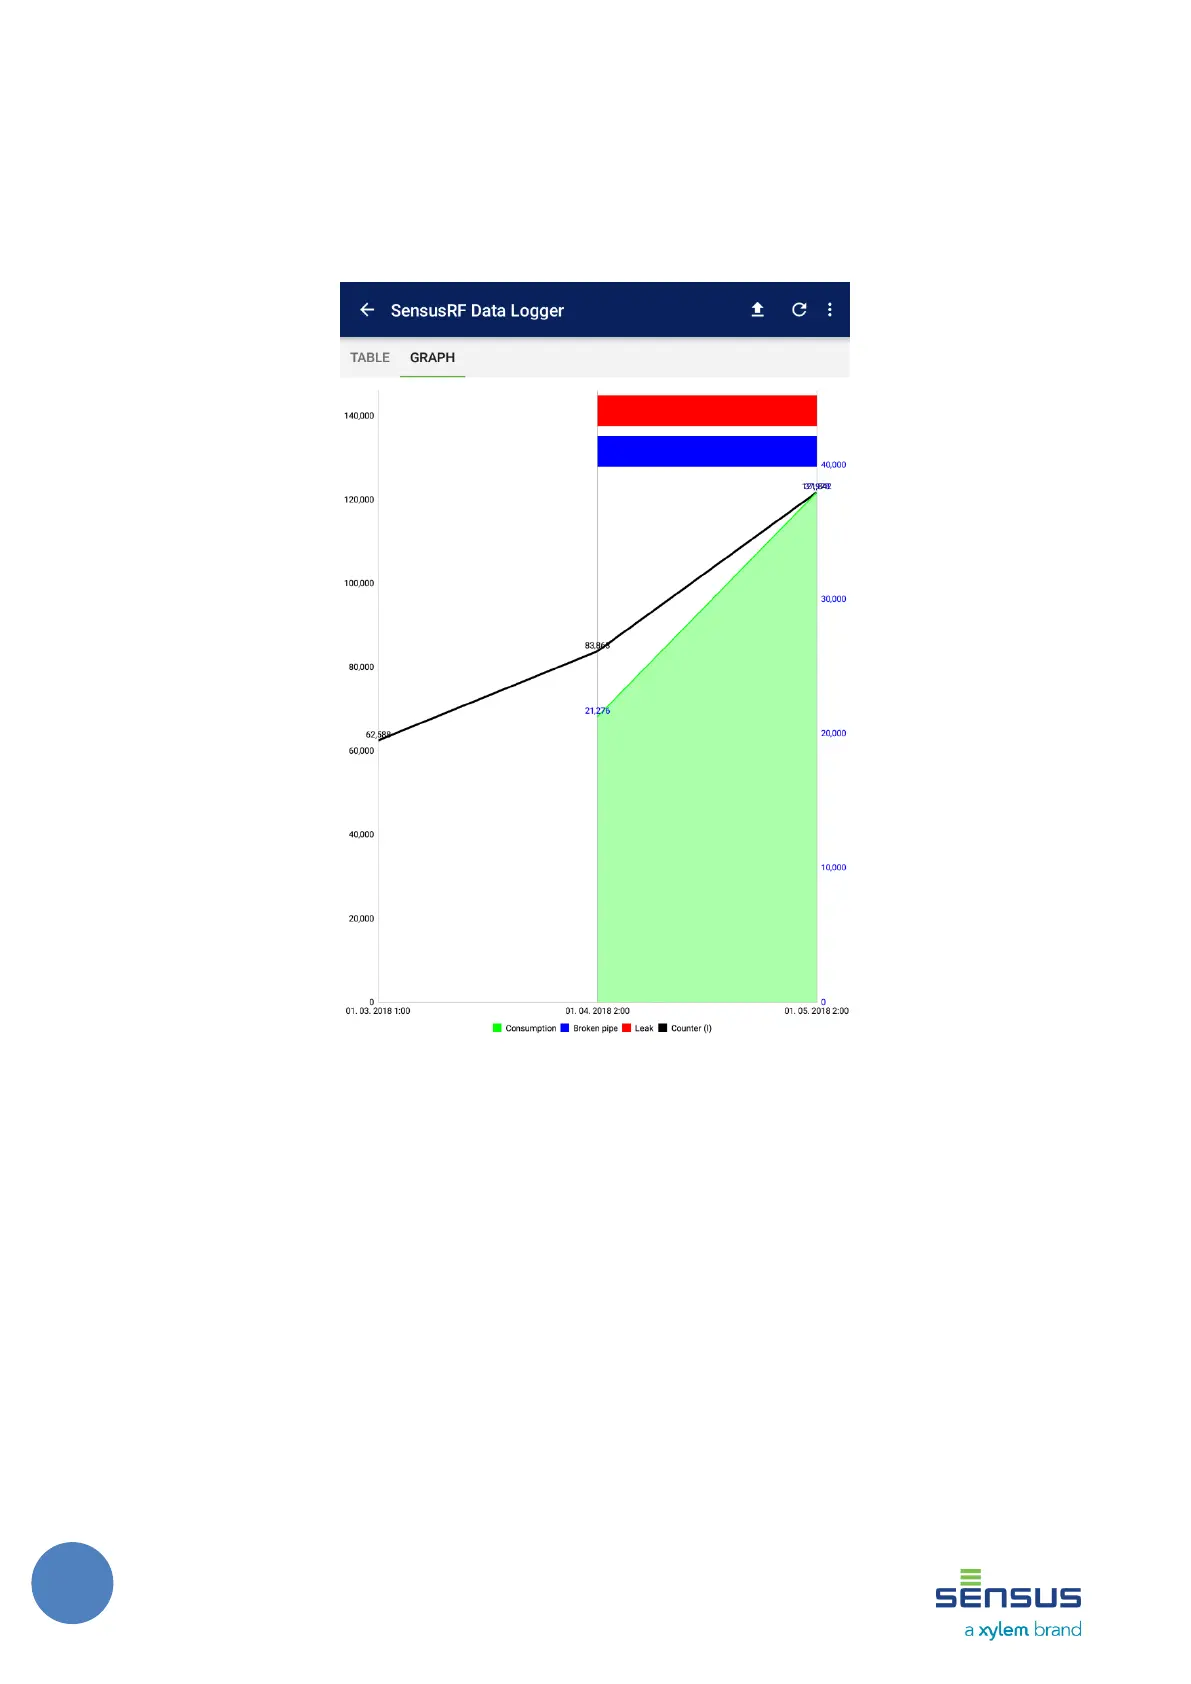
The graph has two y axis which display Volume and Consumption values. Volume represents a line
chart that displays each value of counter from the file. Consumption represents a bar chart that
displays values which is difference between two successive counters. Graph can be seen in the
figure 29.
FIGURE 29: DATA GRAPH EXAMPLE
8 Licensing & Registration
When the Datalogger application is started first time there is a message shown on the screen that
application is running in the trial mode for 60 days. Information about the license status is
displayed in the License screen of the Datalogger Settings in the Summary section (Figure 30).
In order to get valid license key it is necessary to send request for the license by email (Figure 31).
License key is unique for each android device because it is generated according unique Device
serial ID.