• The background currently stored onboard the instrument
will be used to process the data as it is collected in real
time.
• Be sure to collect a new background and store it onboard
the instrument before beginning a real time session
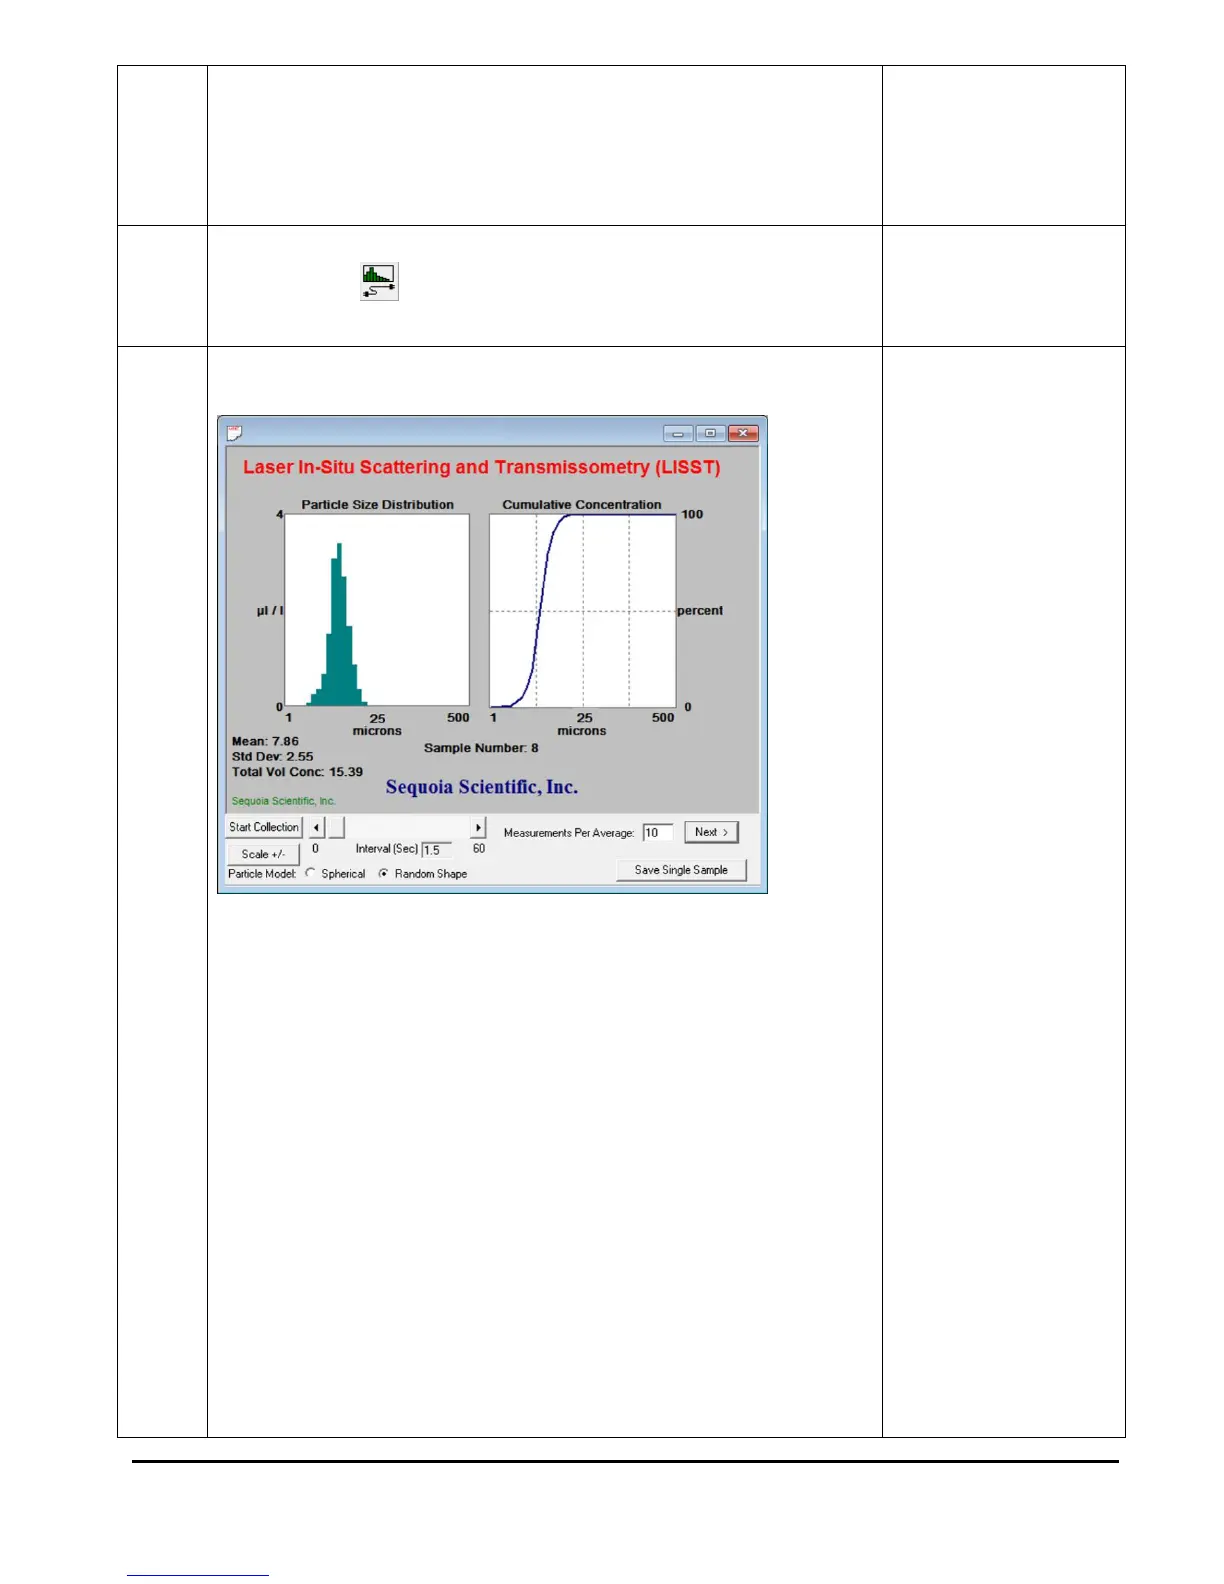
• A display will appear on the screen. It is similar to the
main window of the View Processed Data function.
• The ‘Measurement Per Average’ text box allows you to
adjust the number of measurements that will be averaged
before the display is updated. The default is 10. Higher
values can be used however it may cause a delay that
lasts longer than your selected interval time.
• By selecting the Next button the window will be updated
with the current size distribution. Note that if the water is
clean the display may not show any volume distribution.
• The Sample Number value displayed underneath the
plots will increment each time a sample is saved.
• The radio buttons for labeled ‘Spherical’ and ‘Random
Shape’ allow you to display the volume distribution
calculated with either the spherical or random shape
particle model. The radio buttons only effect the display
and have no effect on the data that is saved in the .CSV
file. If you selected both particle models in part 2, data
from both models will be saved to your computer
regardless of the radio button selection.