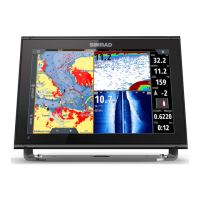
1 Precipitation color shading
2 City forecast icon
3 Wind barb
4 Storm icon
5 SST color bar
6 SST color shading
Use the Sirius weather option menu to select which weather symbology that should be
displayed and how they should appear on the chart panel.
Sirius view options
Precipitation
Shades of color are used to show precipitation type and intensity. The darkest color indicates
the highest intensity.
Rain From light green (light rain) - yellow - orange - to dark red (heavy
rain)
Snow Blue
Mixed Pink
Sea Surface Temperature (SST)
You can show the sea surface temperature as color shading or as text.
When color coding is selected, the SST color bar is shown on the left side of the display.
You define how the color codes are used to identify sea surface temperature. See "Adjusting
color codes" on page 114.
Wave indication
Colors are used to indicate forecasted wave height. The highest waves are dark red, while the
lowest are blue.
You can define how the color codes are used to identify the wave height. Refer to "Adjusting
color codes" on page 114.
Surface features
Turns surface features on/off. Surface features include fronts, isobars, and pressure points.
Surface features cannot be shown at the same time as Wind.
Cloud tops
Turn Cloud tops on/off. Cloud tops indicate the height of the top of the clouds. The color
palette used is grey with darker greys indicating lower clouds. Cloud tops cannot be shown
at the same time as Precipitation or Echo Tops.
112
Weather| NSS evo3 Operator Manual
 Loading...

