When the Pink vacuum bar moves between these zones, a different graph is selected on the Fuel
RPM Map below.
You can click on the mouse button and adjust with a mouse by simply dragging the graph. You
may switch the real-time tracking on so that the green adjustment bar will follow the blue active
bar. Then you will adjust the value where the RPM’s is at the time.
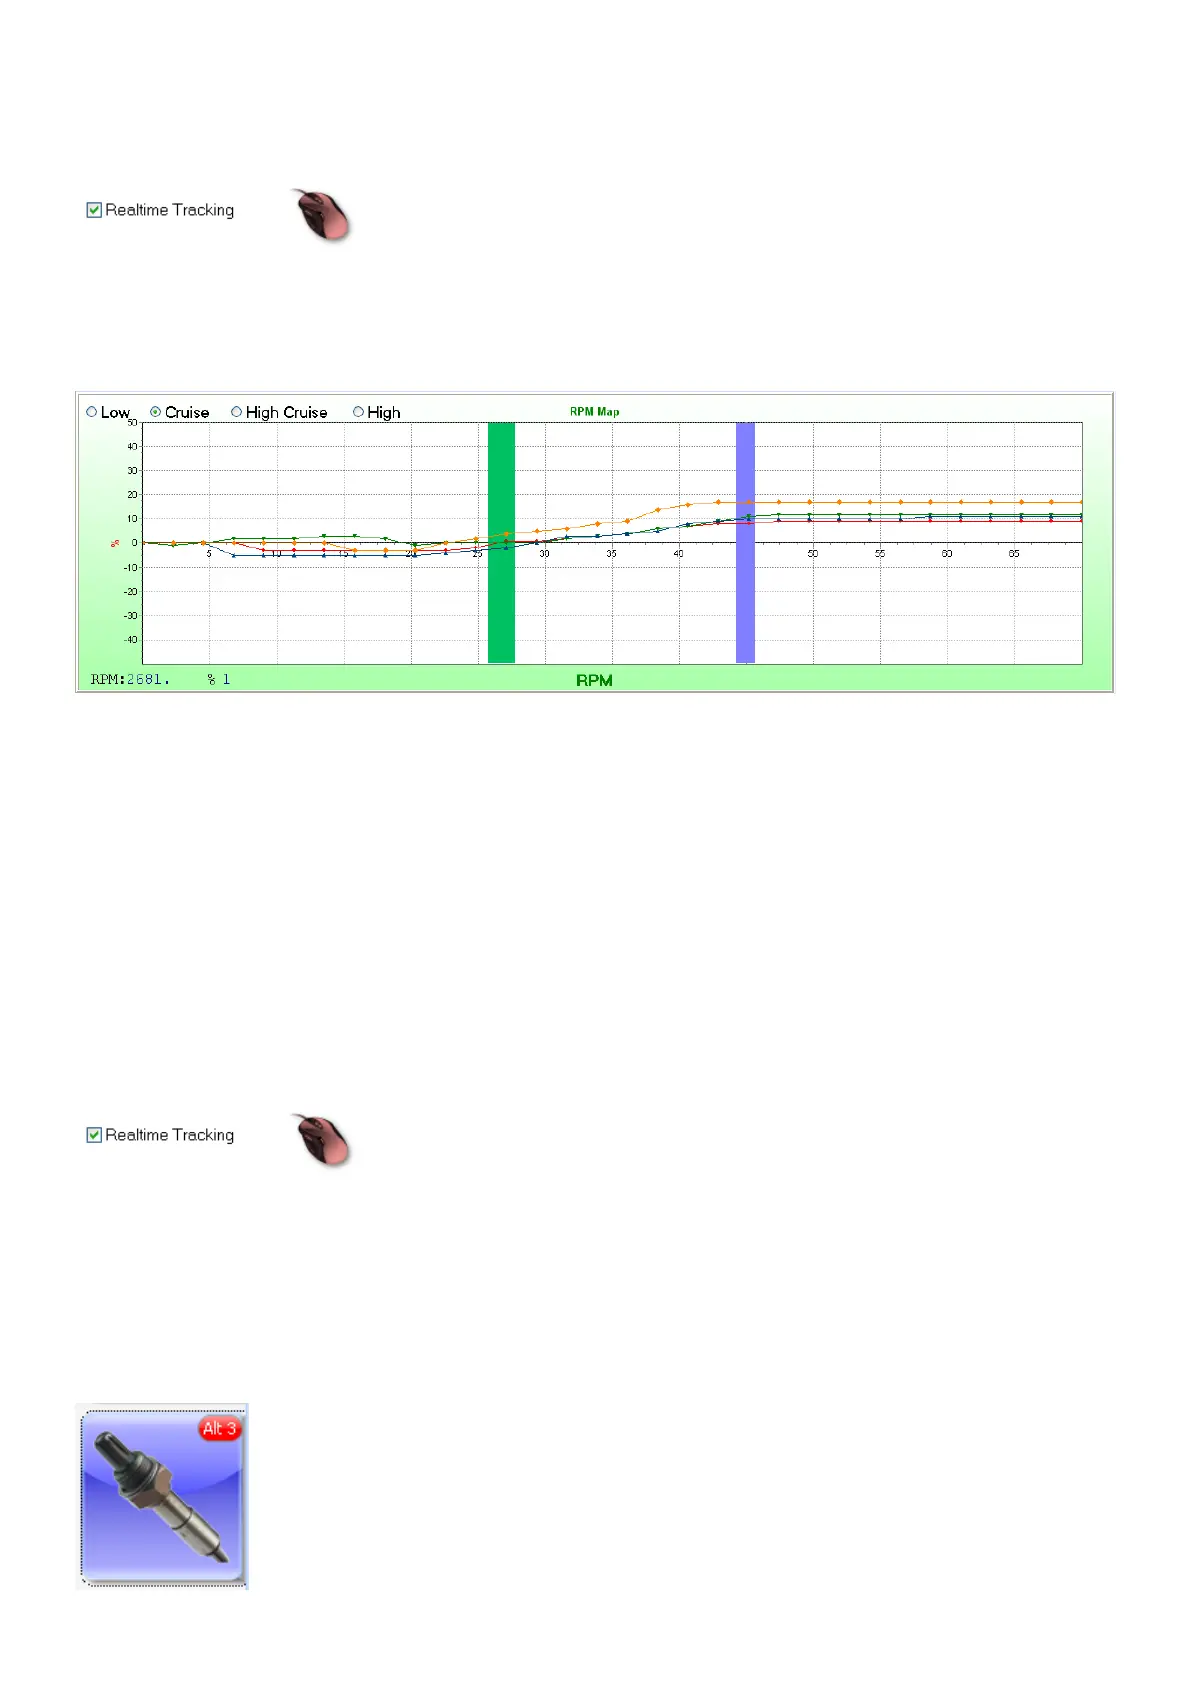
6.8.2.4 RPM Fuel Map
This graph is used to adjust enrichment in different vacuum zones. It is divided in four groups on
the top graph with the Blue arrows. Select the Low, Cruise, High Cruise or High setting and adjust
the fuel enrichment over the rpm range for the specific graph.
Use the Low map for slow town driving and idling deviations. This will be a fuel saver map in urban
conditions.
Use the Cruise map for normal deviation in fair load values on the engine. This map is used for
setting the fuel for open roads.
Use the High Cruise map for normal deviation in higher load values on the engine. This map is
used for setting the fuel for acceleration and uphill roads.
Use the High map for full throttle condition (WOT). This map is to get the maximum power from the
engine. It is normally set in the richer side on the Lambda slide bar. The engine should not run
lean through the RPM range.
Blue bar is the engines current RPM and the Green bar is where your cursor is and where you can
change the values.
You can click on the mouse button and adjust with a mouse by simply dragging the graph. You
may switch the real-time tracking on so that the green adjustment bar will follow the blue active
bar. Then you will adjust the value where the RPM’s is at the time. The different zones will also
change with real time. This will ease with tuning through the whole range.
6.8.3 Lambda Maps (Alt 3)