3. Operating the Dash-2 Kart Logger STACK Dash-2 Kart Logger
10 Users Guide
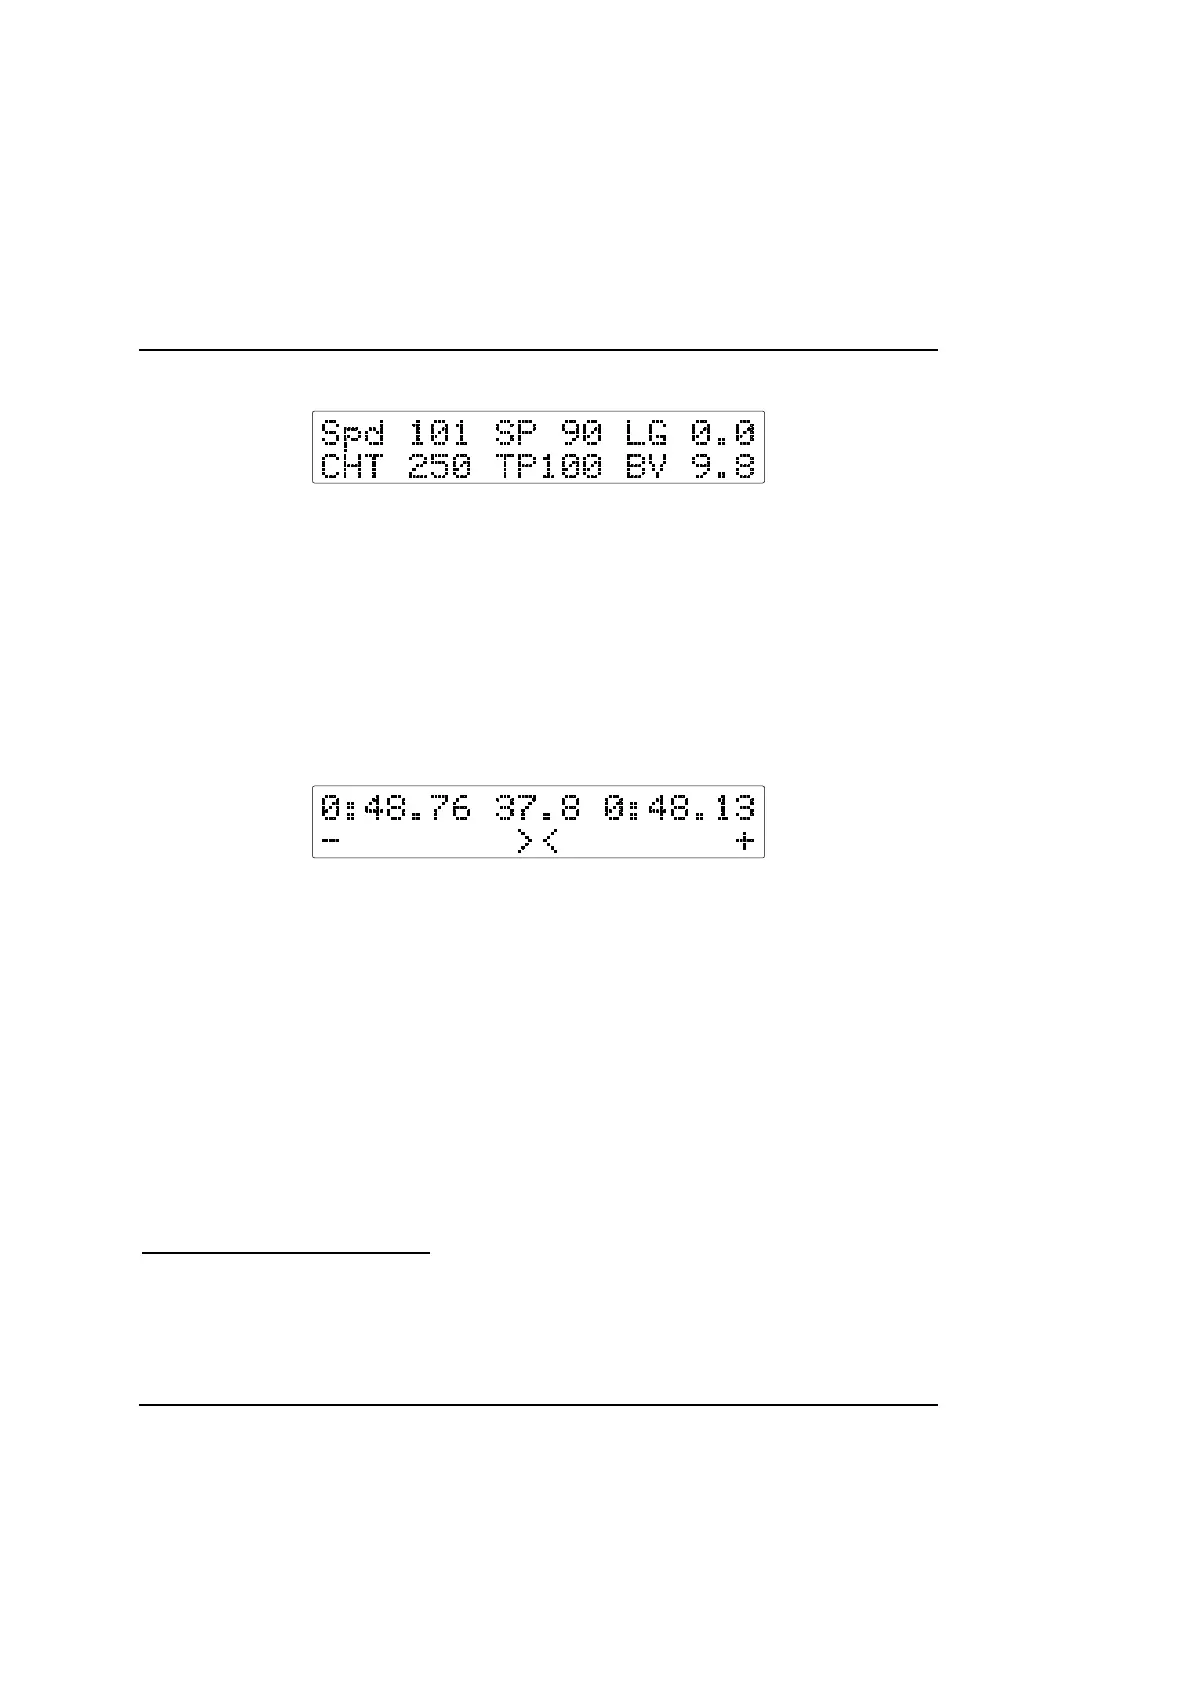
Display Layer 3 - Sensor Test
• Wheel Speed (Spd 101)
• Steering Position (SP 90)
• Lateral G Force (LG 0.0)
• Cylinder Head Temperature (CHT 250)
4
• Throttle Position (TP 100)
• Battery Voltage (BV 9.8)
Press Switch 2 to display layer 4 if option fitted.
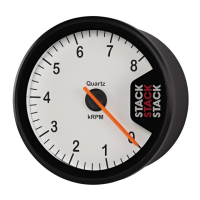
Display Layer 4 - Performance Meter
5
Top Row
• Best lap time (0:48.76)
• Running time from start of lap(37.8)
• Predicted Laptime (48.13)
Bottom Row
• A graphical comparison of this lap to the previous best lap
The performance meter displays a bar growing either to the right or to the left, showing the time gained or lost against your previous
best lap. When the bar goes toward the right (+) you are gaining, and when the bar goes to the left (-) you are losing time.
The predicted lap time tells you what your next lap time will be based upon your gains or losses in the current lap.
Press Switch 2 to step on to the next layer.
Display Layer 5 - Corner Speeds
6
4
This may be replaced with Brake position on some systems.
5
This feature is active only if the Performance Meter has been purchased
6
This display is only available if the corner speed option has been fitted