Instruction Manual
97
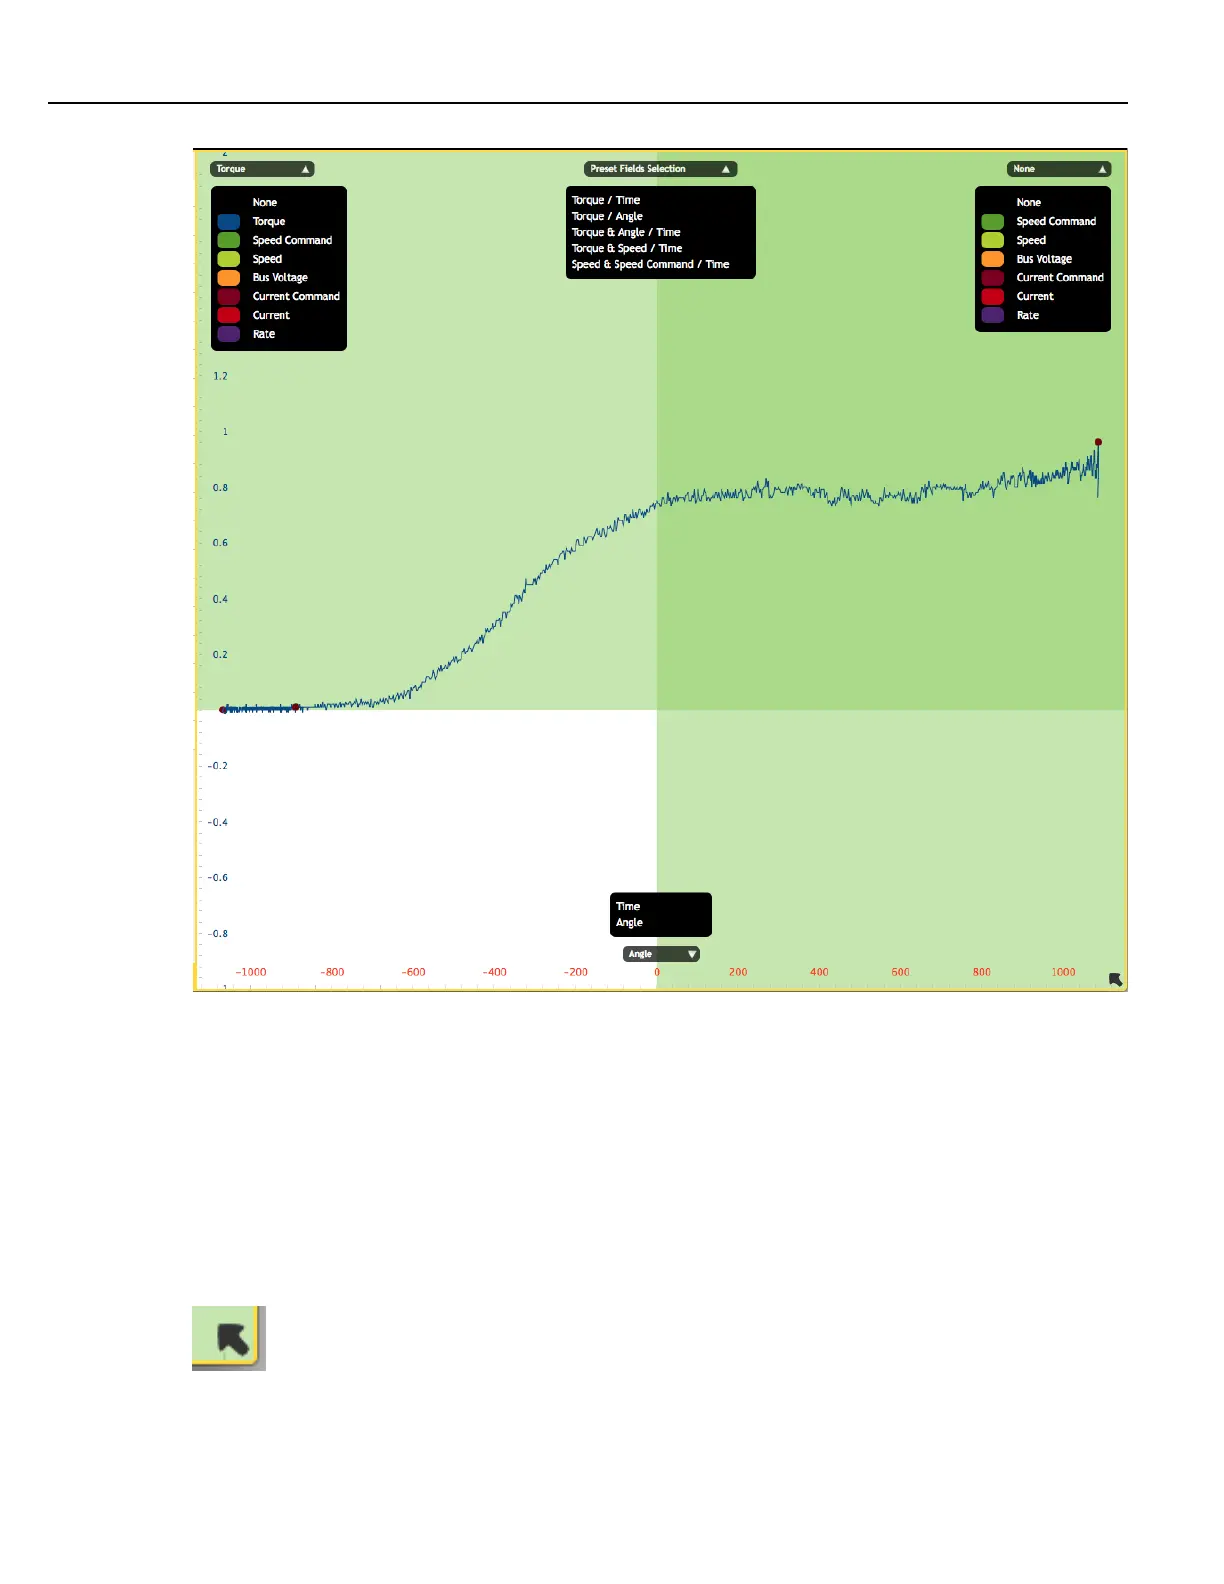
The Y axes field selectors are at the top of each axis. The X axis field selector is at the bottom center of the screen.
An axes presets selector is at the top center of the screen.
Data for the trace is collected every millisecond from start to finish of the fastening cycle. Once the number of data
points exceeds ~2000 the graph is automatically scaled between event points for graph and file manageability
while ensuring a high resolution around the event points. Event points are things such as Threshold Exceeded,
ATC Active and Control Point (target achieved).
The X axis zero point for Time is when the achieved torque reaches or exceeds Task’s Threshold Torque value. The
X axis zero point for Angle is when the achieved torque reaches or exceeds the audit step’s Snug Torque value.
Time and Angle values between start and the zero point are negative.
The Master Detail icon arrow in the bottom right corner of the screen allows the user to zoon in on a graph.
Click the icon to open the Master Detail window.
Y1 Axis Selector
Preset Selector
Torque Window
Angle Window
Graph
Event
X Axis Selector Master Detail Icon
Y2 Axis Selector
Event
 Loading...