28
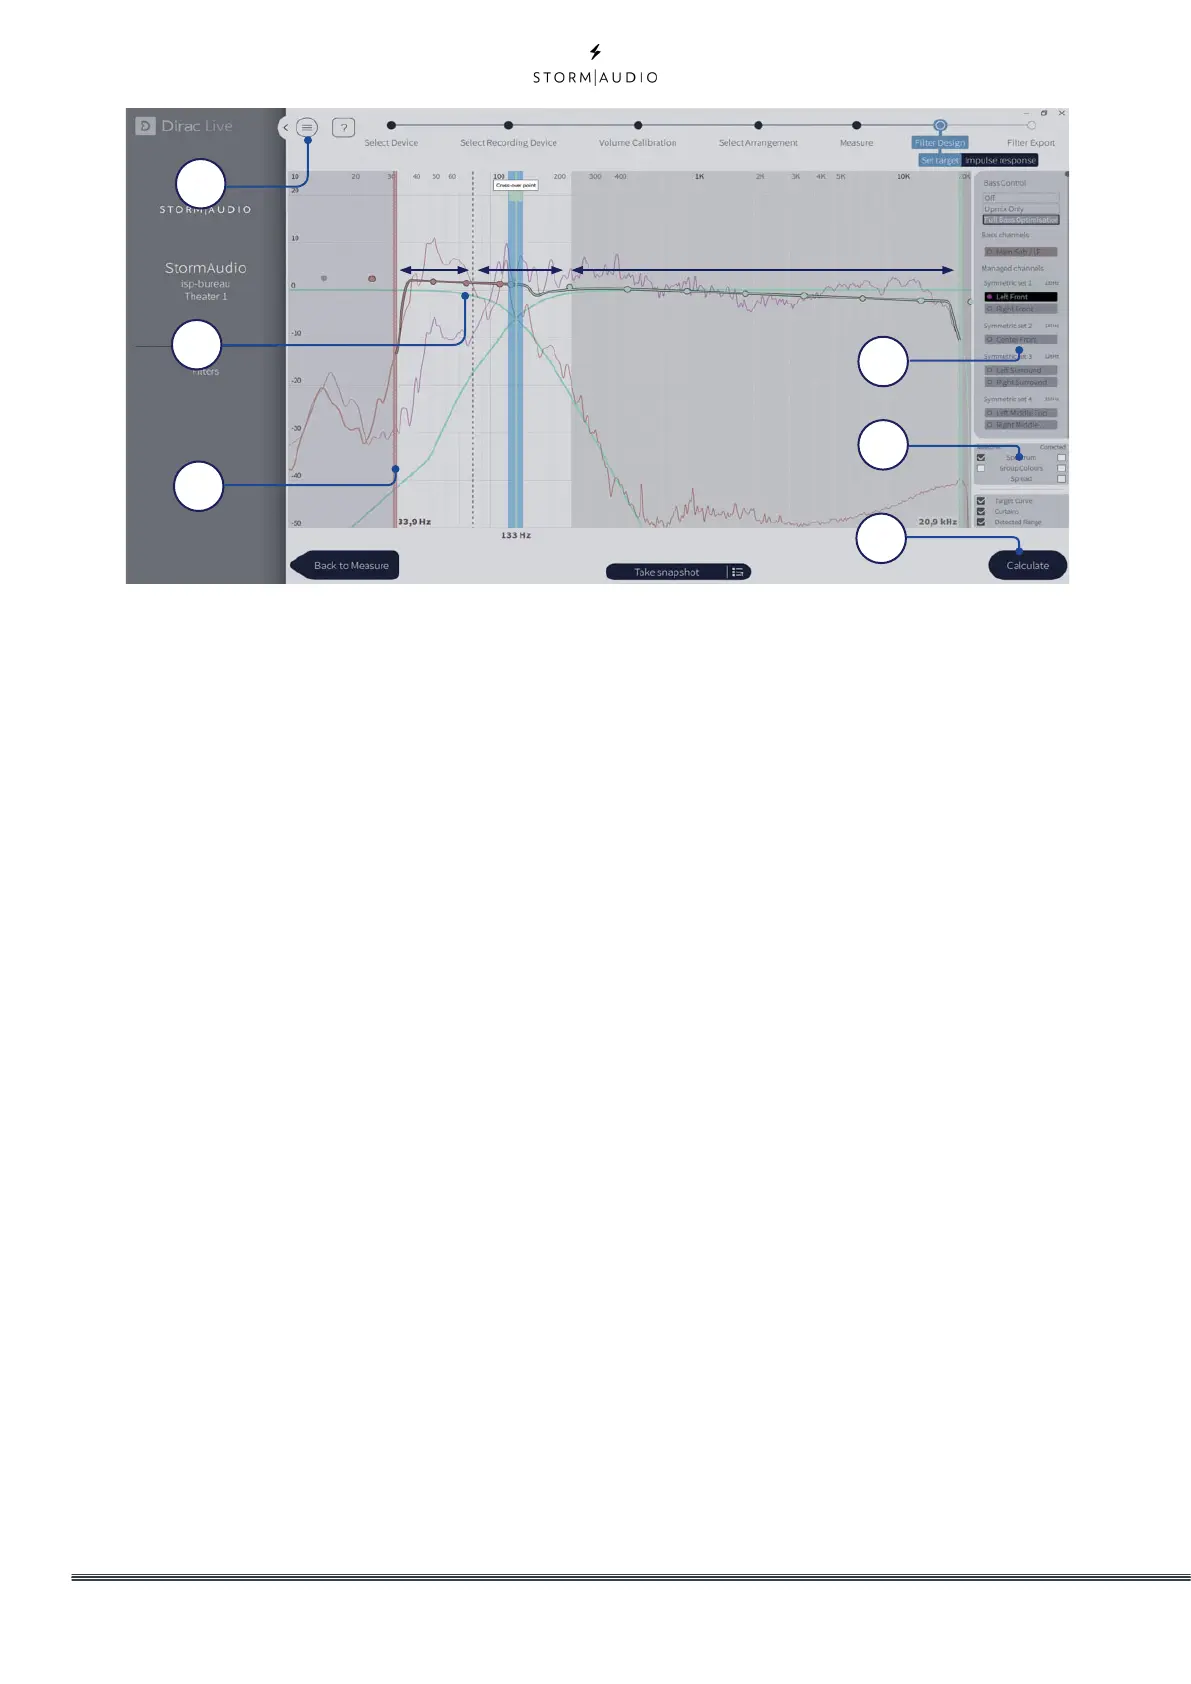
14. Crossover setting
Several magnitude response plots will be
shown in the graph. These plots present
the average magnitude response of the
selected speaker(s) and sub-woofer(s). Select
a crossover-frequency where both the high-
range speaker and the subs-woofer(s) have
energy. The cross-over frequency can be
adjusted by dragging the cross-over bar.
• The crossover filters are highlighted when
hovering over the cross-over bar. Illustrated
above, the lower section (A) of the cross-over
filter describes which frequencies are passed
down to the sub-woofers. Section (B) describes
which frequencies that are passed to both the
sub-woofers and the high-range speaker, and the
upper part (C) describes which frequencies that
are passed to the high-range speaker.
• Note that each speaker group (D) can have an
individual crossover frequency.
15. Target Curve
In Dirac Live Bass Control, just as in standard
Dirac Live 2.0, the color of the sound is set
through a target curve.
In standard mode the target curve is set
per speaker, where the user can change
the coloration of each speaker. When using
Dirac Bass Control, however, the lower
frequency material is often highly correlated
between the speakers, and therefore it is
more convenient to set the target per input-
channel. This new concept of target curve is
described below:
• The input target curve shows the coloration for
the complex summation of the sub-woofer(s) and
high-range speaker from the lower sub-woofer(s)
cut-off frequency to the upper cut-off frequency
for that chosen input channel. The lower section
(A) mainly describes the coloration of how the
sub-woofer(s) sums up together, where section
(B) shows how the sub-woofer(s) and high-range
speaker sums over the cross-over region. Section
(C) describes the desired coloration for higher
frequencies for the chosen speaker. Note that you
can adjust the correction window by moving the
curtain (E)
• The target curve defaults to a flat correction,
which is the audio uncoloured and as close to
the source sound as possible, which may not be
what you prefer. Drag the target-points (F) on
the target curve to change to coloration to your
preferred taste. You can always add more points
by right-clicking on the target curve and select
“Add control point to”.
• Dragging the curve upward above the 0 dB level
on the Y-axis boost the affected frequencies.
Correspondingly, dragging the curve downward
under the 0 dB level attenuates them.
• Increasing the volume of the sub-woofers can be
achieved by raising the part of the target curve
under 100 Hz by a few dB. This is often wanted
when watching movies.
It is possible to save or load target curve
through the menu (G). Good target curve
design is beyond the scope of this document,
but there are some key points to remember.
F
E
G
D
I
H
A B C