Monitoring Audi
o
Usage Notes
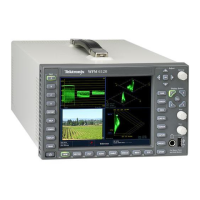
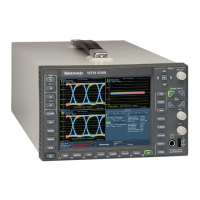
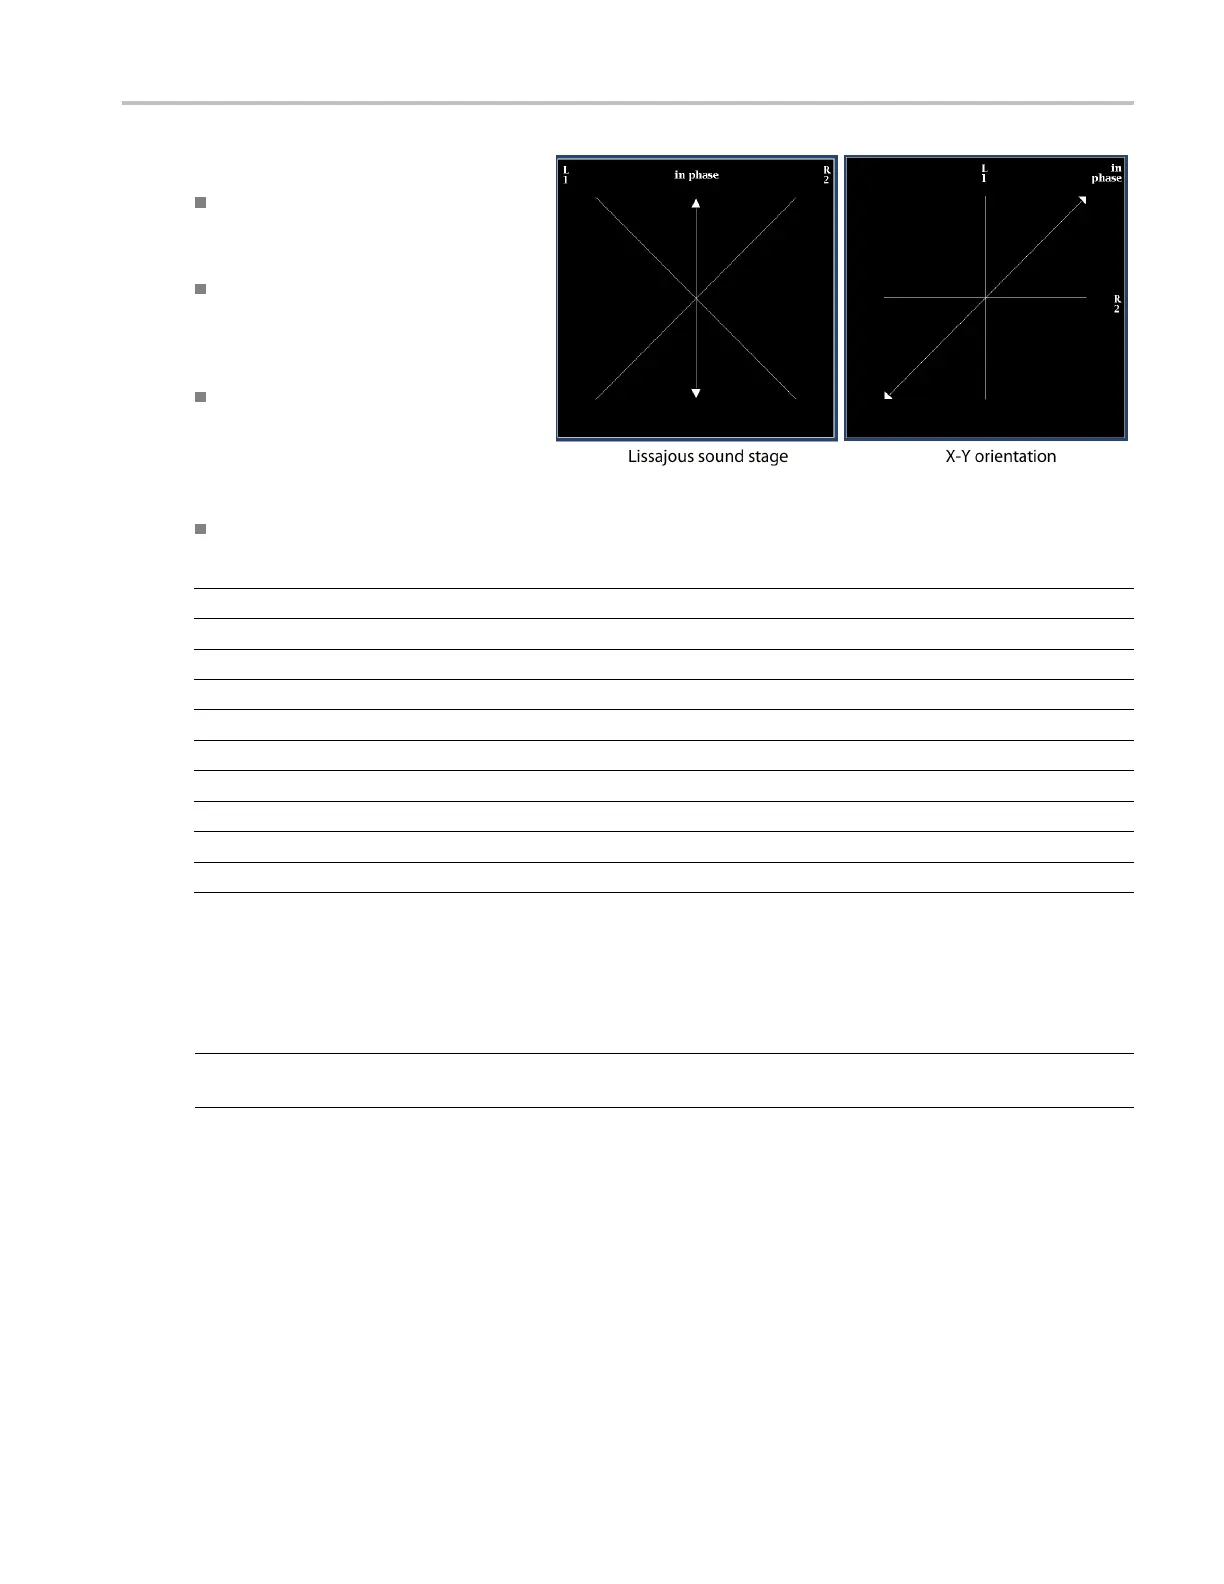
The Lissajous or phase display is a plot
of one channel against another on an
orthogonal pair of axes.
Soundstage plots the two c hannels
at 45 degree angles, with the mono
combination appearing on the vertical
axis—like a left-right image in a studio.
X-Y plots left-channel data on the
vertical axis and right channel data on
the horizontal axis, emulating the X-Y
display of an oscilloscope.
The following response times of the correlation meters can be set from the Configuration m enu.
Speed setting Response averaging time (s) Speed setting Response averaging time (s)
1 0.0167 11 3.0
2 0.0333 12 3.5
3 0.0667 13 4.0
4 0.1333 14 4.5
5
0.2667 15 5.0
6 0.5333 16
5.5
7
1.0 17 6.0
8 (default)
1.5 18 6.5
9 2.0 19 7.0
10 2.5 20
7.5
Checking Audio Loudness
If your instrument has audio logging capabilities (Option ALOG), you can monitor Audio Loudness in a session chart.
NOTE. For a list of the options that are installed on your instrument, press the CONFIG button. In the configuration menu,
sel
ect the Utilities submenu. The View Instrument Options entry lists the options installed on your instrument.
1. Se
lect the tile where you want the Audio
Loudness Session status displayed.
2. Press and hold the STATUS button to
open the Status display in that tile and
d
isplay the Status menu.
Waveform Monitors Quick Start User Manual 93
 Loading...