EasyManuals Logo

Teltonika RUT9 Series Manual

Teltonika RUT9 Series
155 pages
To Next Page IconTo Next Page
To Previous Page IconTo Previous Page
Page #34 background imageLoading...
Page #34 background image
34
Field Name
Sample Value
Explanation
1.
1/5/15 Minutes
Load
0.83
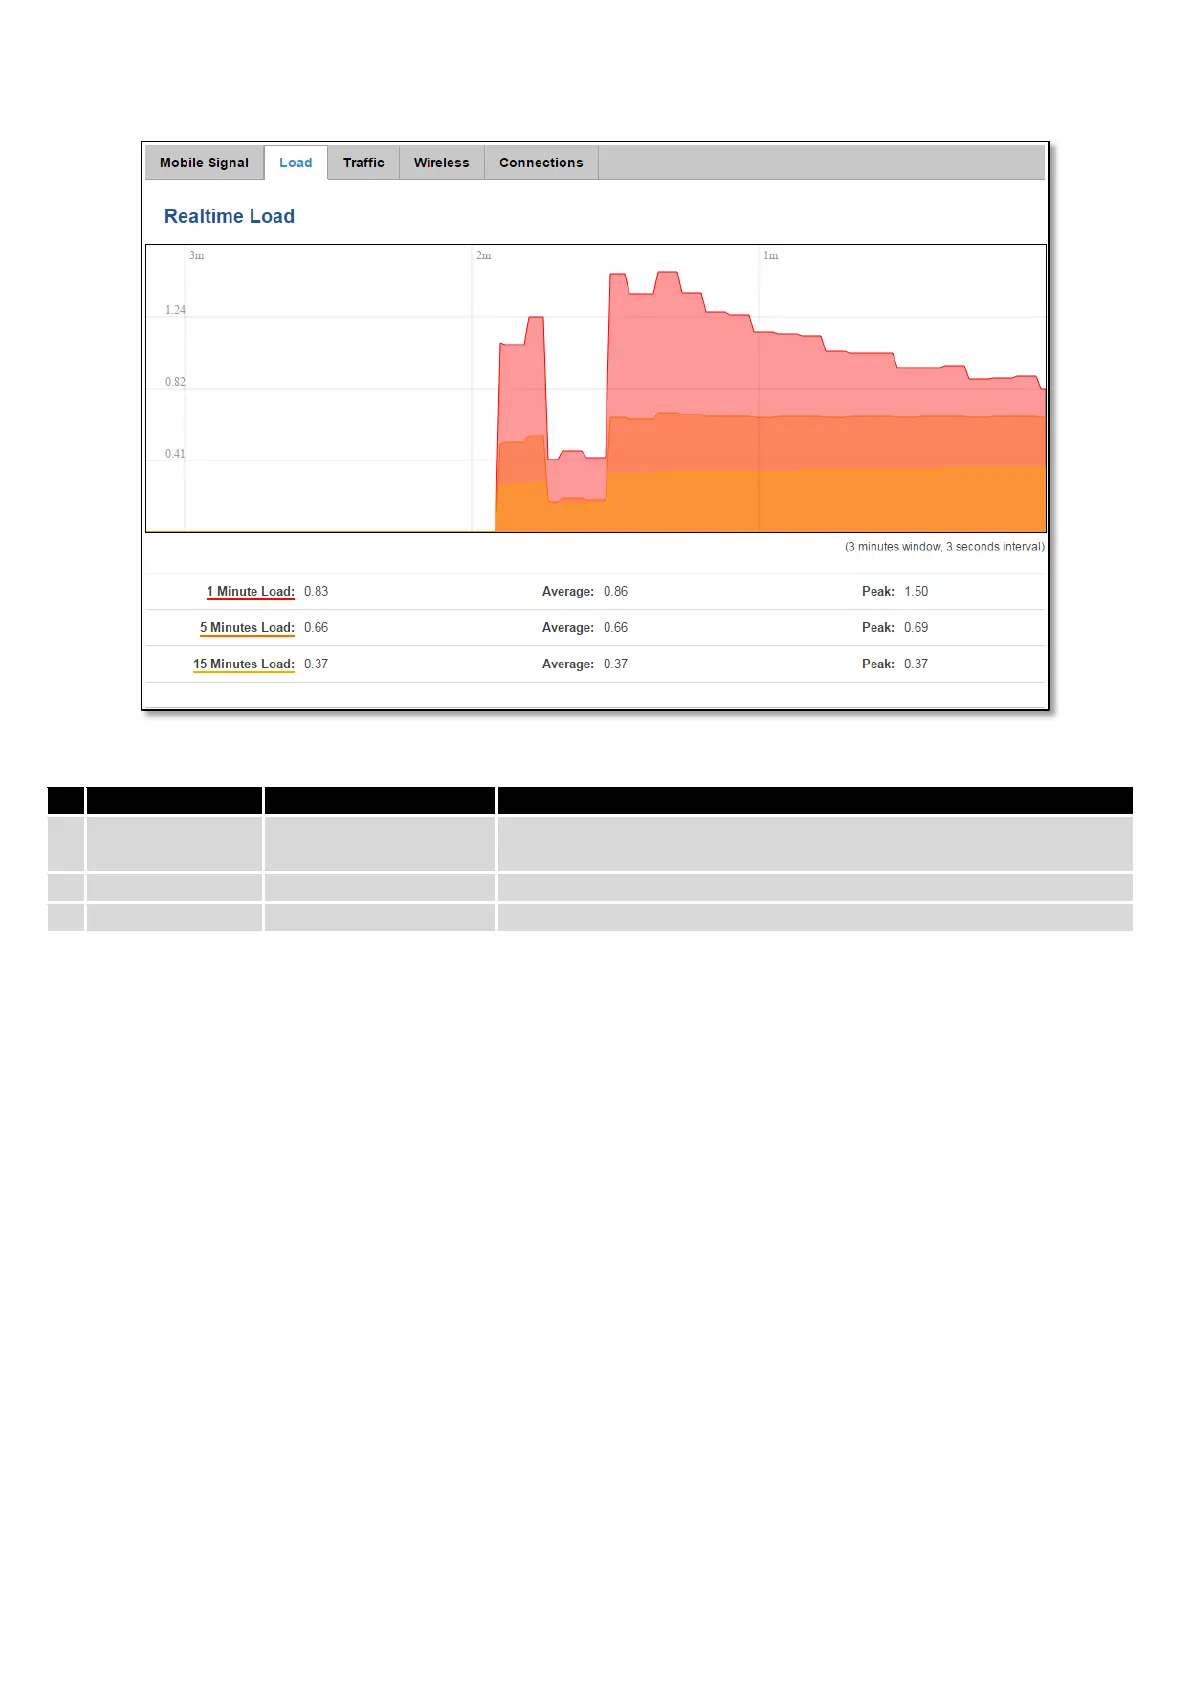
Time interval for load averaging, colour of the diagram
2.
Average
0.86
Average CPU load value over time interval (1/5/15 Minute)
3.
Peak
1.50
Peak CPU load value of the time interval
6.7.3 Realtime Traffic
This graph illustrates average system inbound and outbound traffic over the course of ~3 minutes; each new
measurement is taken every 3 seconds. The graph consists out of two colors coded graphs (green graph shows the
outbound traffic, blue graph shows inbound traffic). Although not graphed, the page also displays peak loads and
average of inbound and outbound traffic.

Table of Contents

Other manuals for Teltonika RUT9 Series

Questions and Answers:

Question and Answer IconNeed help?

Do you have a question about the Teltonika RUT9 Series and is the answer not in the manual?

Teltonika RUT9 Series Specifications

General IconGeneral
BrandTeltonika
ModelRUT9 Series
CategoryNetwork Router
LanguageEnglish

Related product manuals