138 Chapter 4: Development Tools
TI-83 Plus Developer Guide Third Release May 28, 2002
View
T
ool Bar (selected)
S
tatus Bar (selected)
H
elp
A
bout TI Flash Debugger
The tool bar icons, which are defined by hovering the cursor over the applicable icon,
has selections for New (File), Open (File), Save (File).
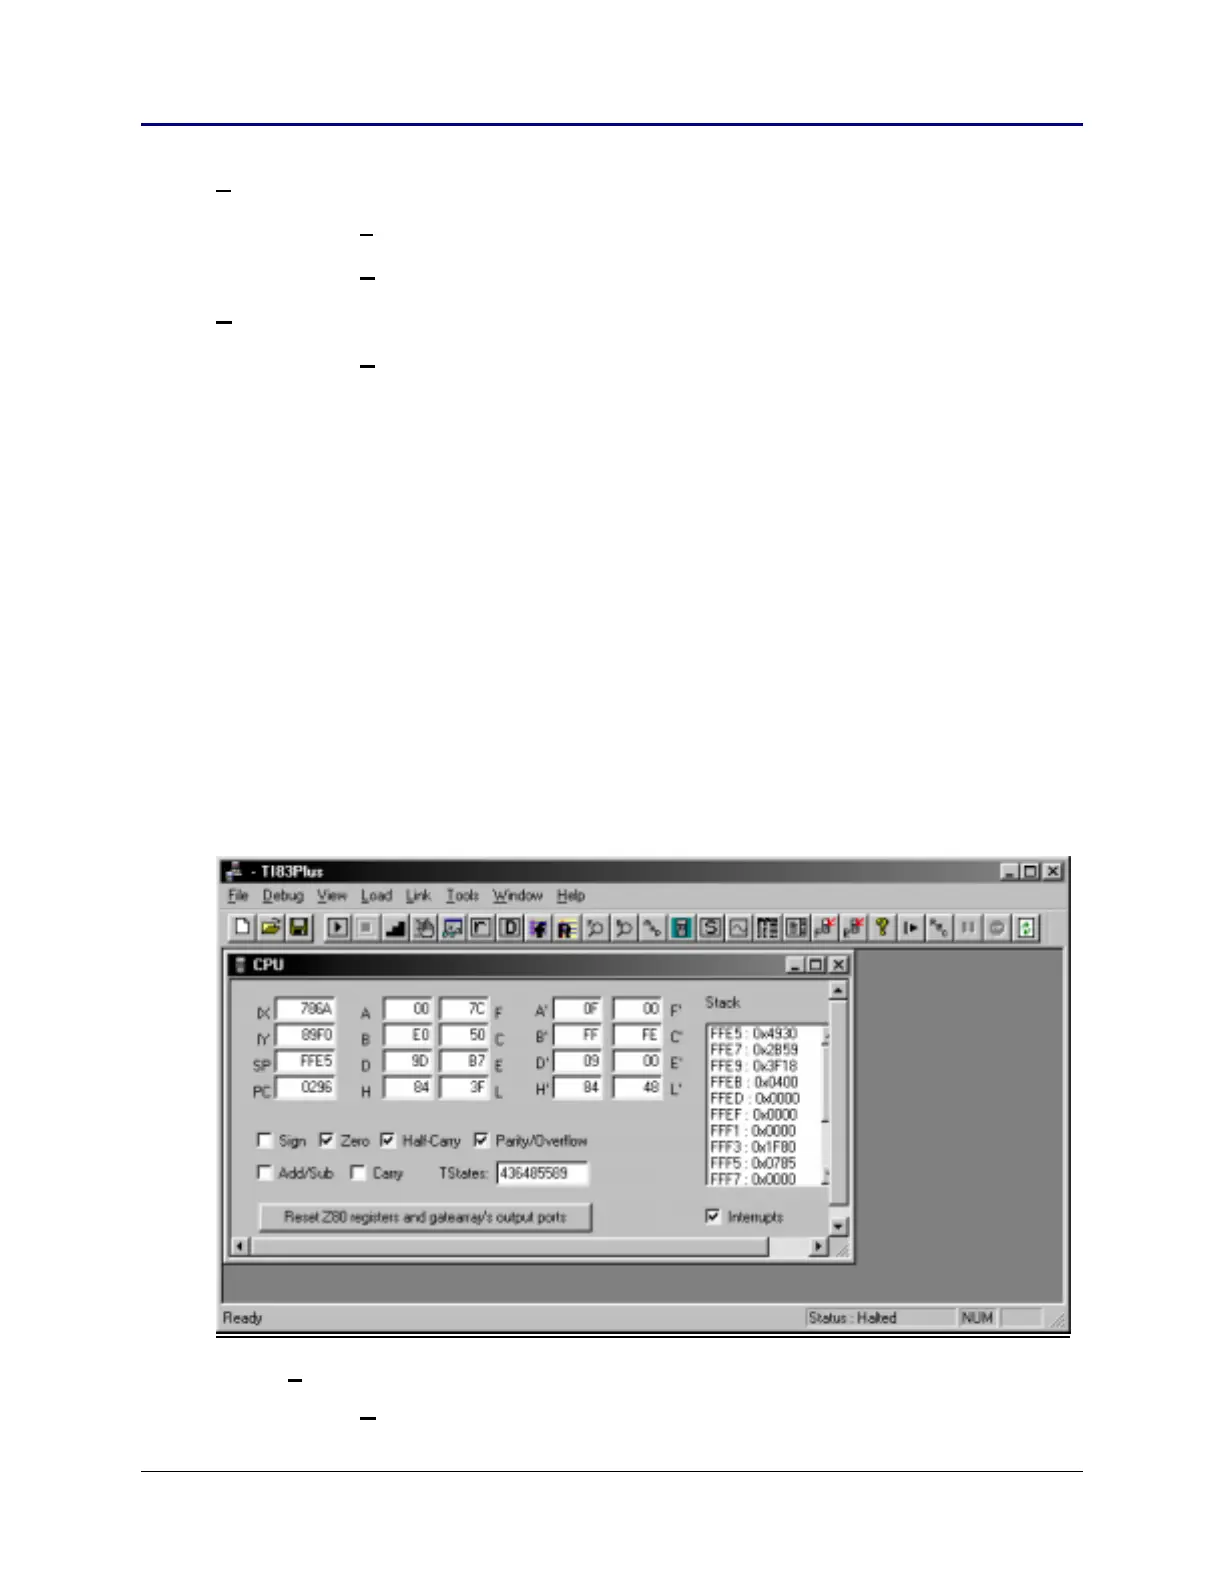
The status bar at the bottom of the window indicates the status of the debugger and
simulator. The left side of the status bar indicates the status of the debugger
(i.e., Ready). The first box on the right side of the status bar indicates the status of the
simulator. In this case, the status of the simulator is halted.
The simulator/debugger uses two files:
<xyz>.83d which contains debug information (breakpoints).
<xyz>.clc which contains the calculator memory contents, where <xyz> is the file name.
The next step is either to create a new debug file or open an existing one. For example
purposes, we will create a new debug file. Upon selecting File/New, you must select the
calculator model (TI-73, TI-83 Plus, or TI-83 Plus Silver Edition) you wish to simulate.
Once you have selected a calculator model, the following CPU view is presented with
additional selections on the menu bar and tool bar as noted below.
File
New Ctrl + N