60
RLC-SVX09Q-EN
6. Check the adjustment and operation of each safety and
operating control.
7. Close all disconnect switches.
8. Refer to the sequence for daily unit start-up for the
remainder of the seasonal start-up.
Sequence of Operation
This section provides basic information on chiller operation
for common events. Adaptive control algorithms are used
on these chillers. This section illustrates common control
sequences.
Software Operation Overview
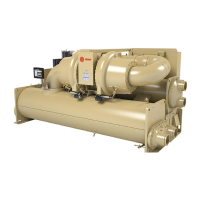
The following figure is a diagram of the five possible
software states. This diagram can be thought of as a state
chart, with the arrows and arrow text, depicting the
transitions between states:
• The text in the circles is the internal software
designations for each state.
• The shading of each software state circle corresponds
to the shading on the time lines that show the chiller’s
state.
There are five generic states that the software can be in:
• Power Up
• Stopped
• Starting
• Running
• Stopping
S huttin g D ow n
R u nnin g
or
R u nnin g Lim it
S top p e d
or
R u n In h ibit
A u to
C o m m an d
C o nfirm ed S tart
S to p C om m
a
n
d
D i
a
gn o s
t
ic
C o nfirm ed
S h utdo w n
B o ot a nd
S elf T e s t
S to p C om m a n d or D ia gn os tic
A u to
or
W aiting to Start
Check for
Differential
to Start
Check for
Differential
to Stop
R e le ase
of Inh ib it
P o w e r U p
In the following diagrams:
• The time line indicates the upper level operating mode,
as it would be viewed in the Tracer
®
AdaptiView™.
• The shading color of the cylinder indicates the software
state.
• Text in parentheses indicates sub-mode text as viewed
in the Tracer AdaptiView.
• Text above the time line cylinder is used to illustrate
inputs to the Symbio™ 800. This may include user
input to the Tracer AdaptiView touch screen, control
inputs from sensors, or control inputs from a generic
BAS.
• Boxes indicate control actions such as turning on
relays, or pulsing compressor load or unload solenoids.
• Smaller cylinders under the main cylinder indicate
diagnostic checks.
• Text outside a box or cylinder indicates time-based
functions.
• Solid double arrows indicate fixed timers.
• Dashed double arrows indicate variable timers.
Power Up Diagram
The following diagram shows the respective TD-7
AdaptiView™ screens during a power up of the Symbio™
800 and display. This process takes 15 seconds for the
Symbio 800 and 105 seconds for the display. On all power
ups, the software model always will transition through the
'Stopped' Software state independent of the last mode. If
the last mode before power down was 'Auto', the transition
from 'Stopped' to 'Starting' occurs, but it is not apparent to
the user.
Start-Up and Shutdown