42 BAS-SVX50F-EN
Data Graphs
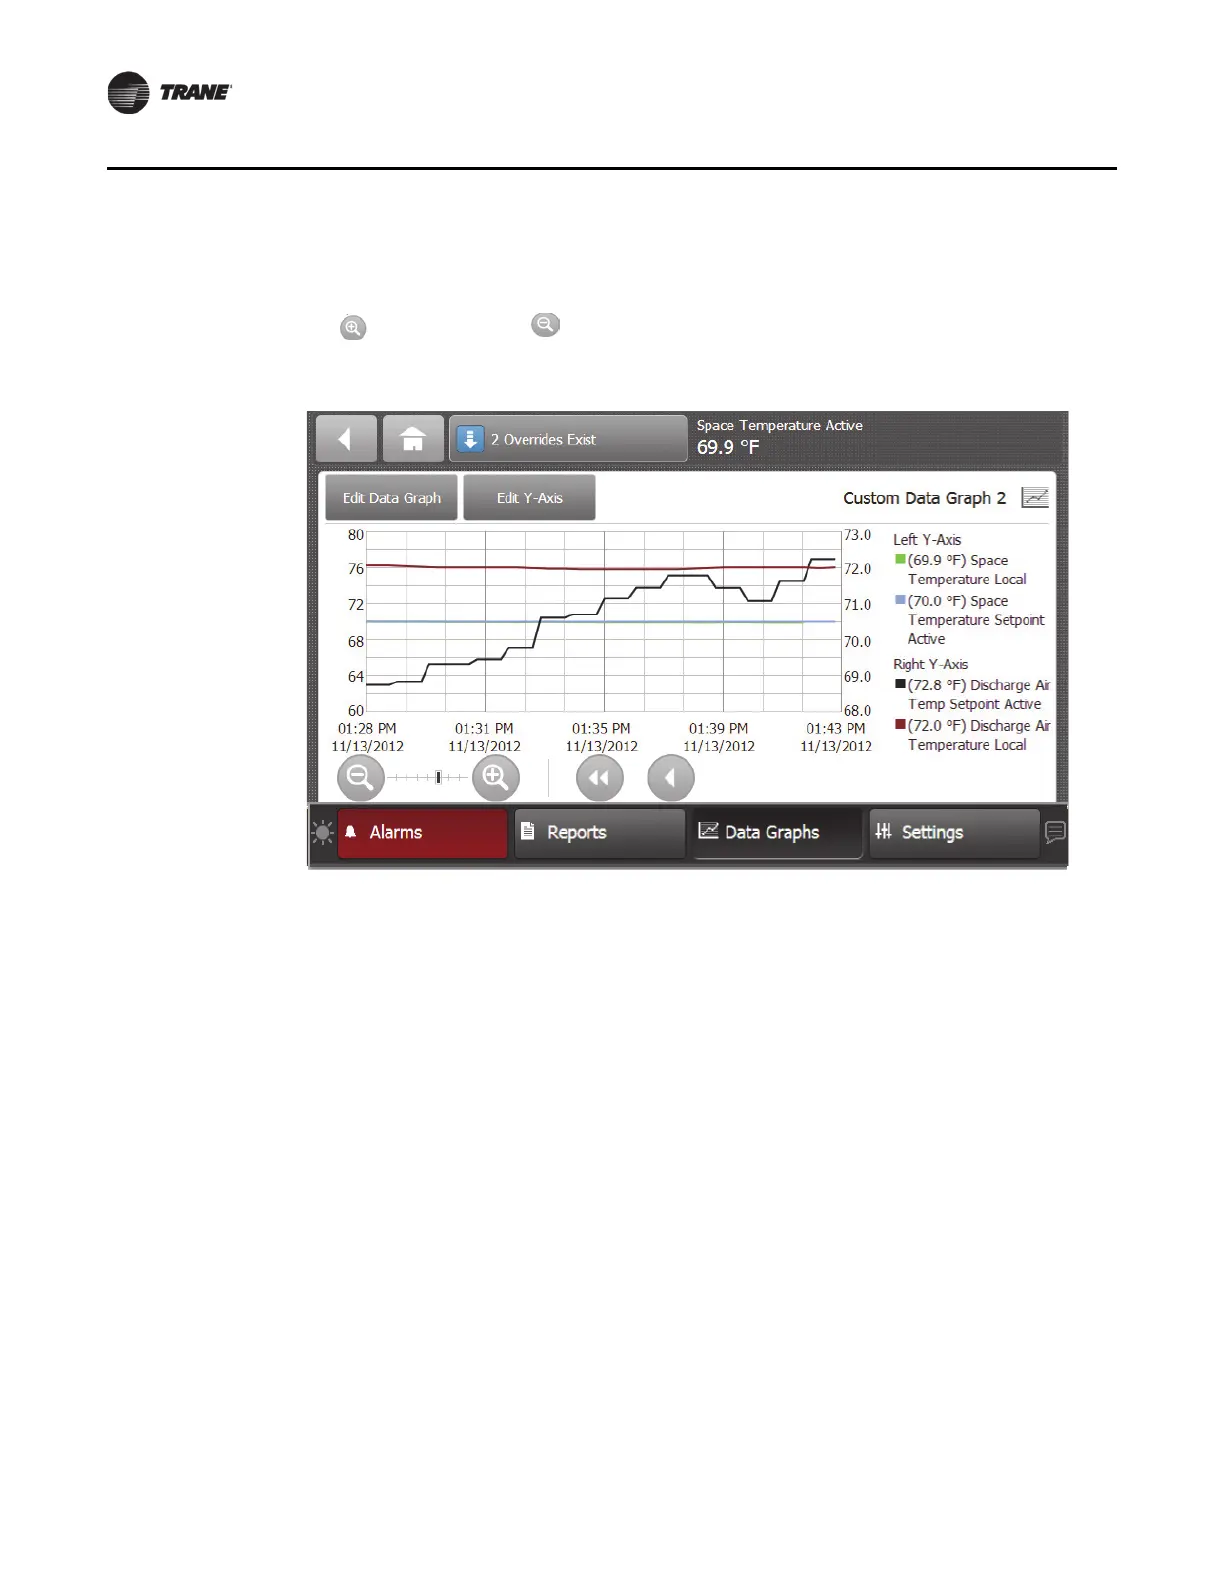
9. Touch the View Data Graph button to display the new graph (Figure 33).
Note: Depending
on the sampling rate, the custom data graph may be empty for several hours.
You can make changes to the way data is
presented on the graph at anytime. Touch the zoom-in
icon and zoom-out icon to either increase or decrease the viewable time frame. This action
also enables back and forward arrows that allow you to view data at various times of the day.
Figure 33. Viewing the data graph
Editing the Y-Axis
The default values on the right and left Y-axes can be changed according to your specifications.
10. Touch the Edit Y-Axis button
located on the top portion of the Custom Data Graph screen.
The Edit Y-Axis screen appears (Figure 30, p. 40).
11. Touch the M
anual
ly Select Range box for either the left or right Y-axis.
12. Touch the edit button next to one of the two value ranges.
The
Keypad screen appears.
13. Select a new value and then touch En
ter to save.
 Loading...