C3 Submersible Fluorometer
998-2300 Rev. H Page 13
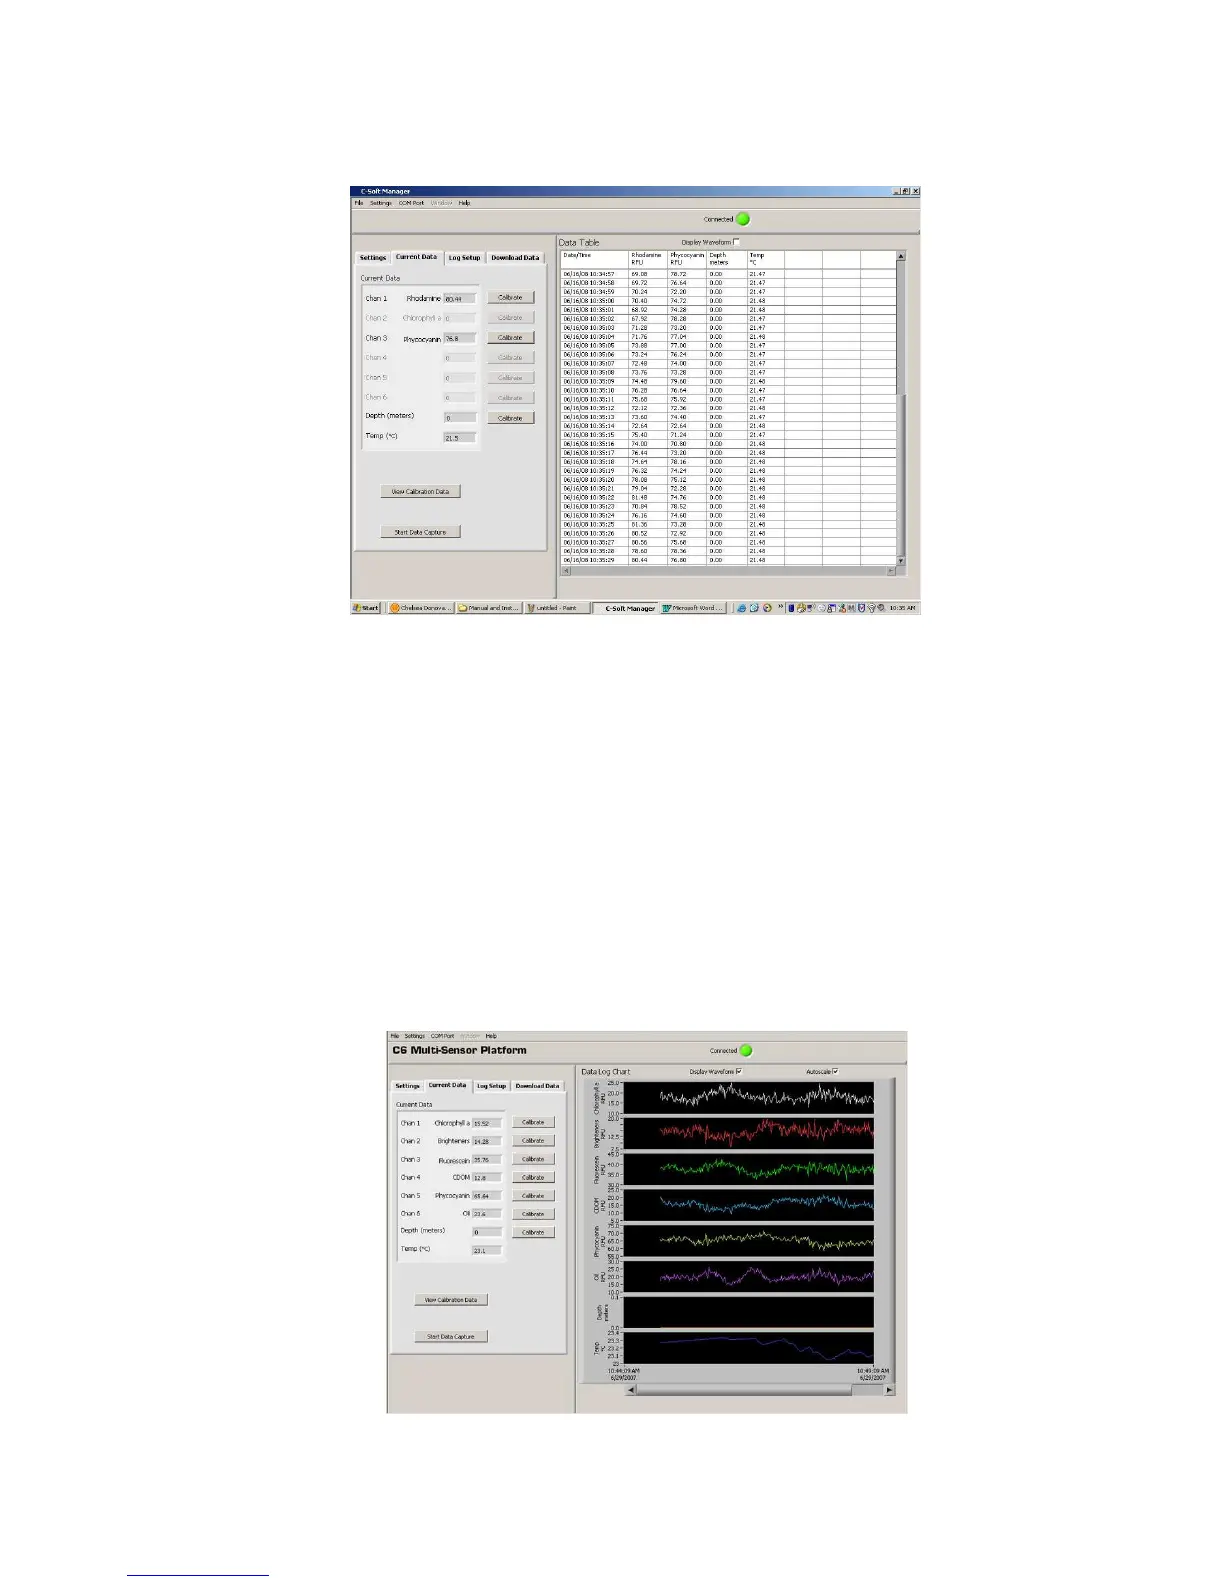
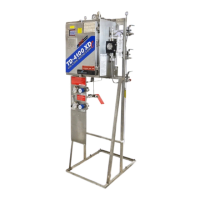
Waveform Screen
Users can graphically view real-time data for each sensor by clicking the
“Display Waveform” box.
♦ Channel names and units will be displayed on the Y-axis.
♦ Time and date will be displayed on the X-axis.
♦ Clicking the “Autoscale” box will automatically scale graphs. Users
may also rescale graphs by unchecking the “Autoscale” box and
manually entering desired values for either Y or X axis ranges.
♦ Data can be saved during waveform mode by clicking “Start Data
Capture”. Data files will be saved as .csv format.