UTD2000 Series User Manual
33
Chapter VI Display System
User can change the display setting of the DSO by pressing the DISPLAY button of
the UTD2000 series DSO as figure below.
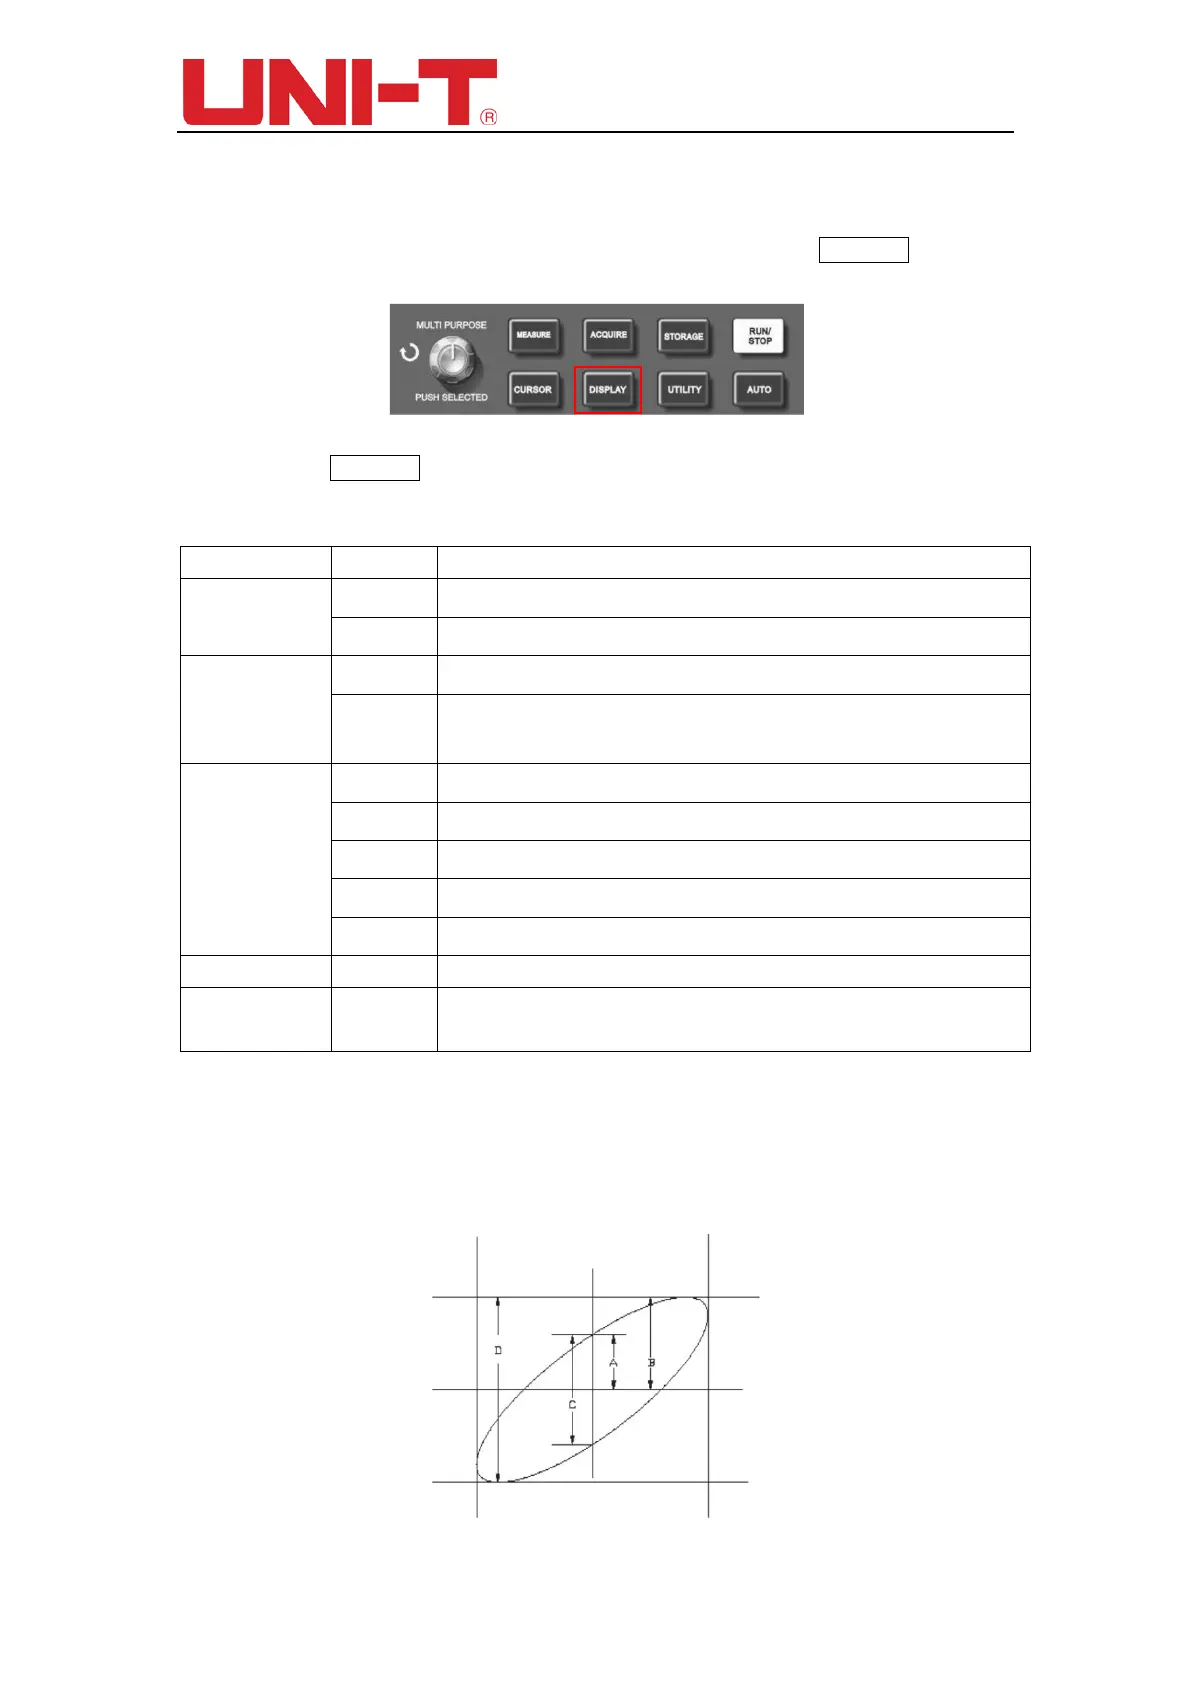
Figure 6-1 Function Keys of Display System
After press DISPLAY button, the function menu will change to the display setting for
the DSO.
Table 6-1 Display Menu
Function Menu Setting Description
Types
Vector Display as vector of sampled data points
Dots Display any of the sampled data points
Format
YT Display Y-axis as voltage level of input signal and X-axis as time
XY
Display Y-axis as CH2 voltage level of input signal and X-axis as CH1 voltage
level of input signal
Persist
Off Real-time updating (Display) of the acquired signal.
1s Display the acquired signal every 1s
2s Display the acquired signal every 2s
5s Display the acquired signal every 5s
Infinite Accumulate display all the acquired
——
Brightness 1%-100% Set the brightness of the waveform by multi-purpose node between 1%-100%
brightness.
6.1 XY Mode
The phase difference between the two signals of the same frequency can be easily
observed by Lissajous method. The following chart gives the observation of phase
difference.
 Loading...