Verifying the Antenna Field of View
Not many of us would be tempted to get on the roof or climb to the top of a tower to perform a 360° visual inspection to identify any
potential satellite signal obstructions. But even if you do, you won’t be able to “see” interference, multi-path or other RF effects.
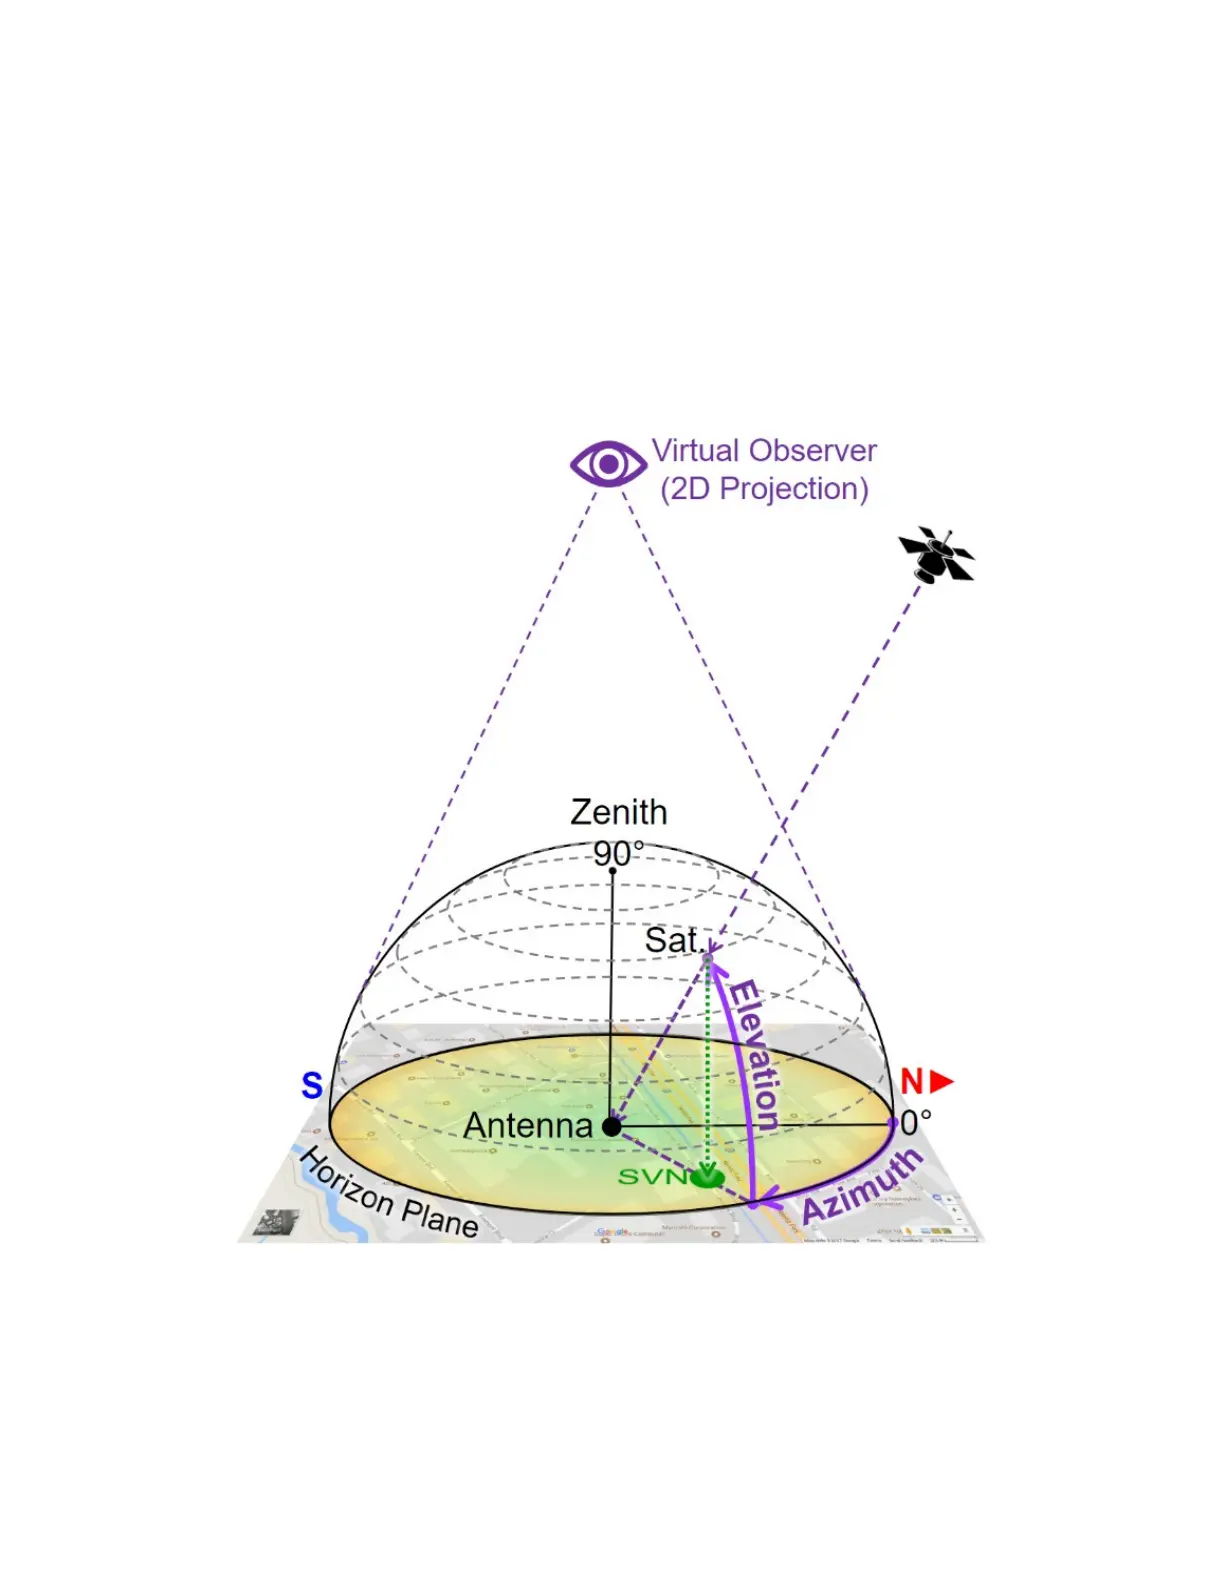
As all “visible” GNSS satellites move around their orbits, the directional vectors pointing at them form a dome above the antenna.
Their received signal qualities change over time, depending on their elevation angles, obstructions, reflections and other factors.
To track this, you need a tool that records the C/No of every satellite as they pass by the antenna’s aperture (field of view), to create
a flat (2D) projection of a 360° color-coded dome-shaped “heat” map representing the field of view of the antenna and the signal
quality from every direction. These azimuthal graphs allow you to identify areas (directions) with degraded signal quality.
Virtual Observer
Building such maps usually takes >24 hours, to allow each satellite to complete one cycle over the antenna (not to be confused with
their ~12-hour orbital cycles).
TX300s_Platform_Manual_RevB00