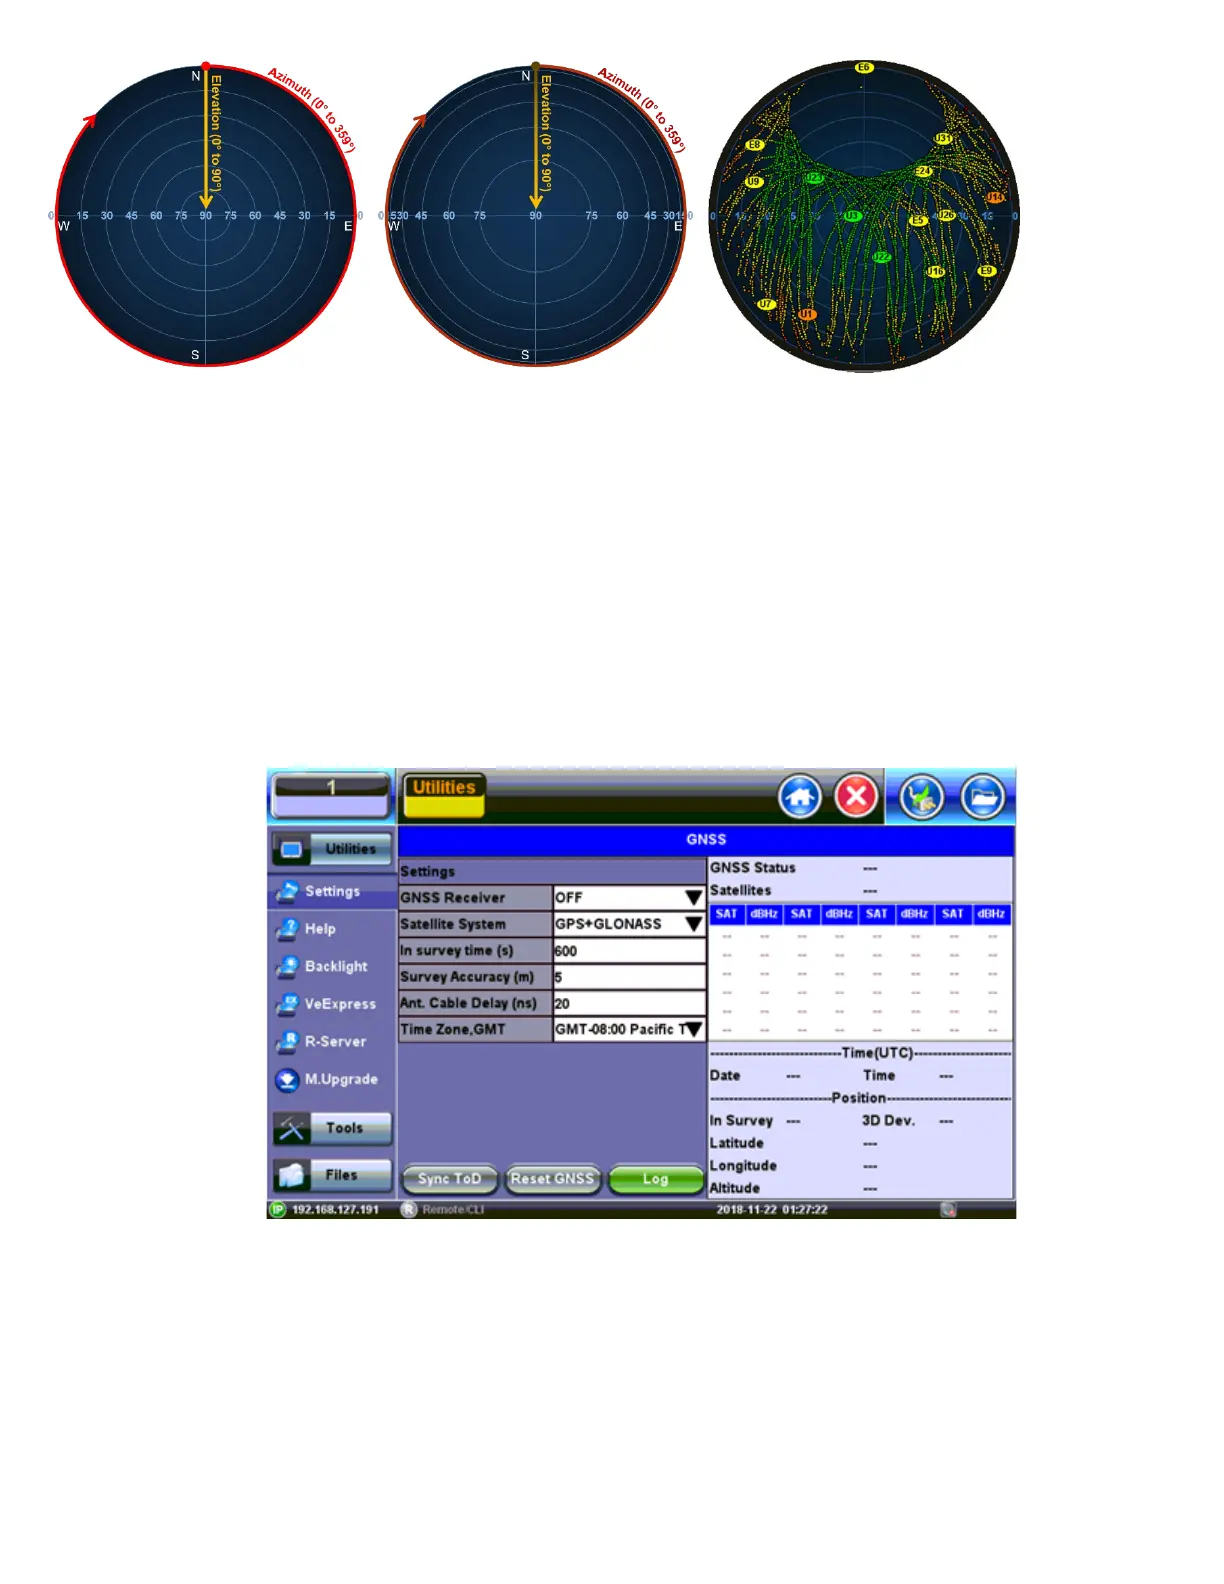
Examples of 2D Linear and Cosine projection (polar) grids, as well as actual satellite trails recorded
This type of tool can also be used to evaluate and bench-mark different antennas in real life and under the same conditions.
The areas in yellow indicate the directions where the degraded satellite signals are, such as RF “shadows” cast by trees and
buildings. They can also indicate interference. As the signal quality degrade even more they turn orange and red. The example
below shows the correlation between the sky view map and a map of the area around the antenna.
7.5.8 GNSS Sky View
1. Go to >Utilities >Settings >More >High Precision Clock.
2. Turn the GNSS Receiver = OFF and close the screen.
GNSS Receiver Off
3. Go to >Tools>Advanced>More>GNSS.
4. Select the Time Zone from the Time Zone Offset: drop-down list box.
5. Enter a Test Name from the File Name: drop-down list box.
6. Select the Duration of the test from the Duration: drop-down list box.
TX300s_Platform_Manual_RevB00