EasyManua.ls Logo

Velodyne HDL-64E S3 User Manual

Velodyne HDL-64E S3
54 pages
To Next Page IconTo Next Page
To Previous Page IconTo Previous Page
Page #9 background imageLoading...
Page #9 background image
HDL-64E S3
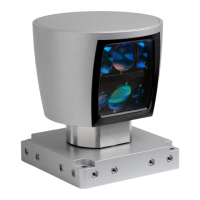
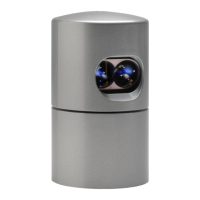
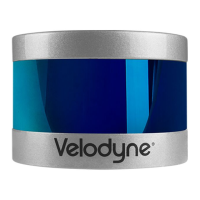
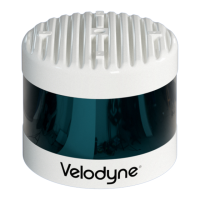
High Definition LiDAR Sensor
Page 9
Velodyne LiDAR, Inc.
©
2019
63-HDL64ES3 REV K
View Image
The sensor needs no configuration, calibration, or other setup to begin producing viewable data.
However, you need to apply the calibration file to set the accuracy of the data. Once the unit is mounted
and wired, supplying power to the sensor will cause it to start scanning and producing data packets.
Data points may be viewed by either of the following methods:
1. Use the included point-cloud viewer (DSR Viewer)
2. Develop you own application-specific point-cloud viewer
1. Use the Included Point-cloud Viewer
The quickest way to view the data collected as a live image is to use the included Digital Sensor Recorder
(DSR) application. DSR is Velodyne’s point-cloud processing data viewer software. DSR reads in the
packets from the sensor over Ethernet, performs the necessary calculations to determine point locations
and then plots the points in 3D on your PC monitor. Both distance and intensity data can be observed
through DSR. If you have never used the sensor before, this is the rec
ommended starting point. For
more on installing and using DSR, see Appendix C.
2. Develop Your Own Application-specific Point-cloud Viewer
Many users elect to develop their own application-specific point cloud tracking and plotting and/or storage
scheme, which requires these fundamental steps:
1. Establish communication with the sensor.
2. Create a calibration table either from the calibration data included in-stream from the sensor or
from the included .xml data file.
3. Parse the packets for rotation, block, distance and intensity data
4. Apply the calibration factors to the data.
5. Plot or store the data as needed.
The following provides more detail on each of the above steps.
1. Establish communication with the sensor.
The sensor broadcasts its data via UDP packets. By using a network monitoring tool, such as
Wireshark, you can capture and observe the packets as they are generated by the sensor. See
Appendix E for the UDP packet format. The default source IP address for the sensor is
192.168.3.43, and the destination IP address is 192.168.3.255. To change the IP configuration,
see the Define Sensor Memory IP Source and Destination Addresses section.
2. Create an internal calibration table either from the calibration data included in-stream from the
sensor or from the included .xml data file.
This table must be built and stored internal to the point-cloud processing software. The easiest
and most reliable way to build the calibration table is by reading the calibration data directly from
the UDP data packets. A MatLab example of reading and building such a table can be found in
Appendix D, and on the CD included with the sensor.
Alternatively, the calibration data can be found in the included .xml file found on the CD included
with the sensor. A description of the calibration data is shown in the following table.

Table of Contents

Question and Answer IconNeed help?

Do you have a question about the Velodyne HDL-64E S3 and is the answer not in the manual?

Velodyne HDL-64E S3 Specifications

General IconGeneral
Laser Count64
Field of View360° horizontal, 26.8° vertical
Accuracy±2 cm
Operating Temperature-10°C to +60°C
Frame Rate5-20 Hz
Angular Resolution (Vertical)0.4°
Laser Wavelength905 nm
Rotation Rate5-20 Hz
Ingress ProtectionIP67
Data Output RateUp to 1.3 million points per second
Angular Resolution (Horizontal)0.08°
Range120 meters (for 10% reflectivity)

Summary

Safety Notices

Important Safety Instructions

Key safety instructions and warnings for operating the sensor.

Cautionary Guidelines

Important warnings and guidelines to reduce risks and maintain warranty.

Introduction

In the Box

Lists the contents of the sensor shipment.

Principles of Operation

Installation

Mounting Options

Details on mechanical mounting and considerations.

Electrical Connections

Covers power, Ethernet, and serial interface setup.

Lockout Circuit Function

Explanation of the laser firing prevention circuit.

View Image

Included Point-cloud Viewer

Using the DSR application for live data viewing.

Custom Point-cloud Viewer Development

Steps for creating custom data visualization software.

Change Run-Time Parameters

Serial Communication Setup

Specifies communication parameters and sample files for serial commands.

Upload Calibration Data

External GPS Time Synchronization

Synchronizing sensor data with GPS time pulses.

Laser Firing Sequence and Timing

Firmware Updates

Appendix A: Mechanical Drawings

Appendix B: Connector Pin outs

Power, Serial & GPS Connector

Pin assignments for the Deutsch DT06-8S connector.

Ethernet Connector

Pin assignments for the M12 D-CODED Ethernet connector.

Appendix C: Digital Sensor Recorder (DSR)

DSR Installation and Calibration

Instructions for installing DSR and using calibration files.

DSR Live Playback

Steps for viewing live data streams using DSR.

Appendix D: MATLAB Sample Code

Appendix E: Data Packet Format

Data Packet Structure Overview

Details the sensor's UDP Ethernet packet format.

CRC Checksum Algorithm

Appendix F: Dual Two Point Calibration Methodology & Code Samples

Coordinate Calculation Algorithm

Describes the methodology and provides sample code for data calculation.

Intensity Compensation and Calibration

Calibration Window Parameters

Details focal distance and focal slope for intensity scaling.

Appendix G: Ethernet Timing Tables

Sensor Ethernet Transmit Timing

Tables showing time elapsed for data capture and transmission.

Laser and Detector Arrangement

Laser Position Views

Diagrams showing laser positions from rear and wall views.

Appendix I: Angular Resolution

Appendix J: Troubleshoot

Appendix K: Service and Maintenance

Appendix L: Specifications

Related product manuals