43
Review Daily or Hourly Histograms of
Trend Data
You can view histograms of trend data that may include:
• Tachycardia detections (without stimulation)
• AutoStim stimulations
• Magnet mode stimulations
• Prone position (model 1000 only)
• Low heart rate (model 1000 only)
To view a histogram of trend data:
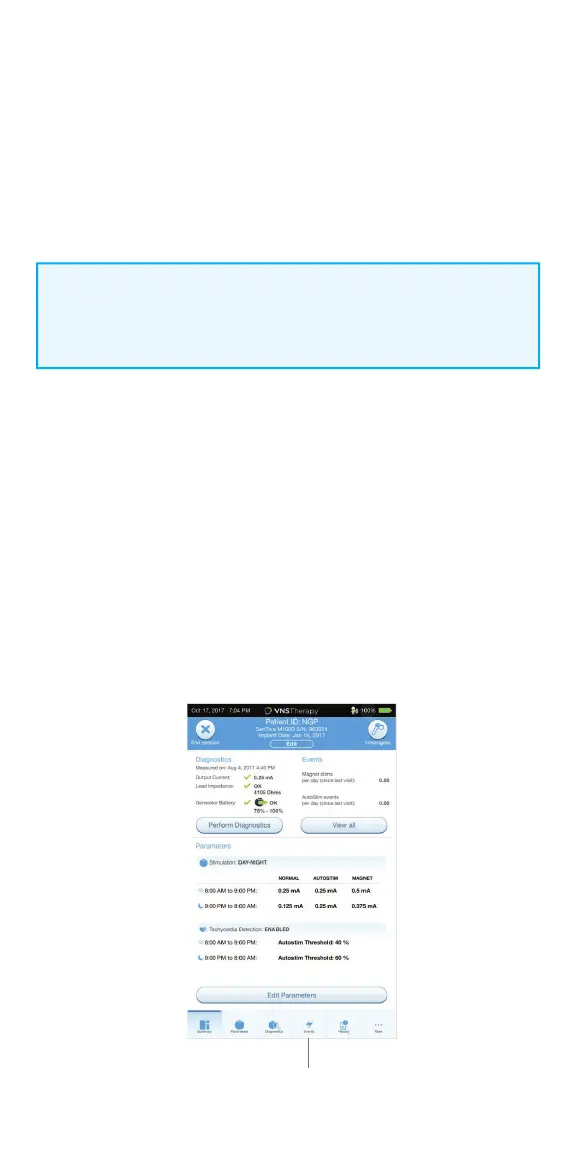
1. From the Summary Screen, tap on the EVENTS button in the Navigation Bar
at the bottom of the screen, and then select the TRENDS tab
2. To download timestamp information from the generator, place the wand
over the generator and tap the DOWNLOAD DATA button
3. Check the colored boxes to select the event types you want to include in
your histogram
4. Tap on the button displaying the date to adjust the timeframes
5. Tap on EVENTS PER DAY to show one month of detection data in a
day-by-day format
6. Tap on EVENTS PER HOUR to show detection data in an hour-by-hour
format. Choose the timeframe and event types you want to display
NOTE:
The data download is only required for M1000 if the user wants to view
specifi c timestamps.
Events