104
EN
Tendency indicators
• Tendency arrows allow you to quickly determine of temperature or
pressure are rising and falling in a three hour update period, updated
every 30 minutes.
• Eg. : At 3:00 - compare to 12:00 data; at 3:30 -compare to 12:30 ….. etc
Rising > 3 % > 1 °C/ 2 °F > 1 hpa
Steady <= 3 % <= 1 C°/ 2 °F <= 1 hpa
Falling > 3 % > 1 °C/ 2 °F > 1 hpa
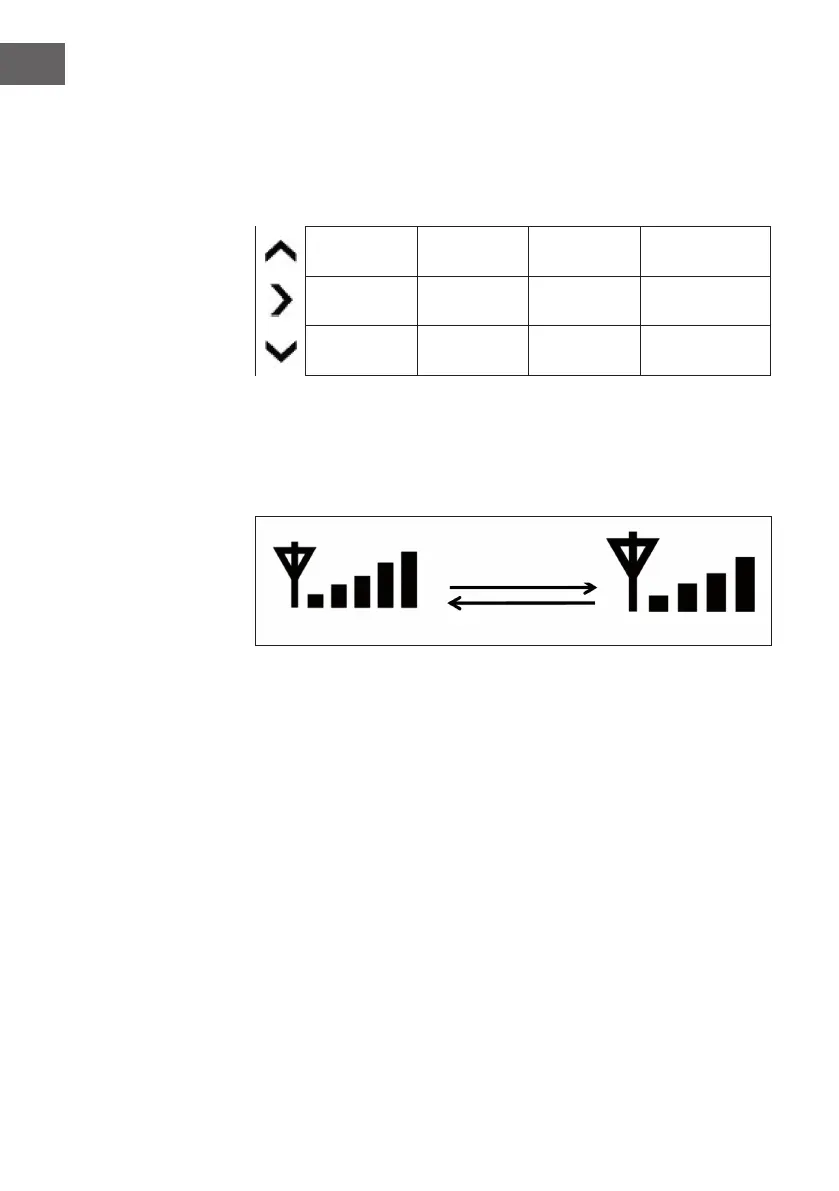
Wireless Signal Strength Indicator
• The wireless signal strength displays reception quality. If no signal is lost,
the signal strength indicator will display 5 bars.
• If the signal is lost once, four bars will be displayed.
 Loading...