en - Original instructions
e-SV series - Installation, Operation and Maintenance Manual 39
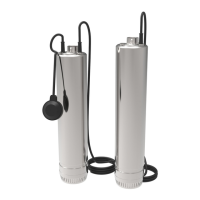
8.3 Maximum operating pressure
The diagram shows the maximum operating pressure based on unit model and temperature of
pumped liquid.
Figure 19: Temperature-pressure diagram
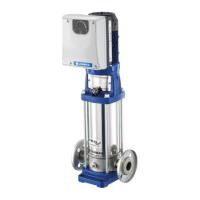
P1max + Pmax ≤ Maximum operating pressure (PN)
NOTE: The formula applies to units with motor with axially locked bearing on the drive side
(standard Xylem).
Figure 20: Pressure diagram
8.4 Maximum number of starts per hour
0
5
10
15
20
25
30
35
40
45
-40 -20 0 20 40 60 80 100 120 140
-40 -4 32 68 104 140 176 212 248 284
P [bar]
t [°C]
t [°F]
PN 40
PN 25
PN 16
EPDM
FPM
PTFE
ESV_M0011_A_ot
ESV_M0014_A_sc
P1max
P1max + Pmax
Pmax

 Loading...