Administrator‘s Guide for Yealink Video Conferencing Systems
156
user interface or using the Ethernet software. By analyzing the packets captured for
troubleshooting purpose.
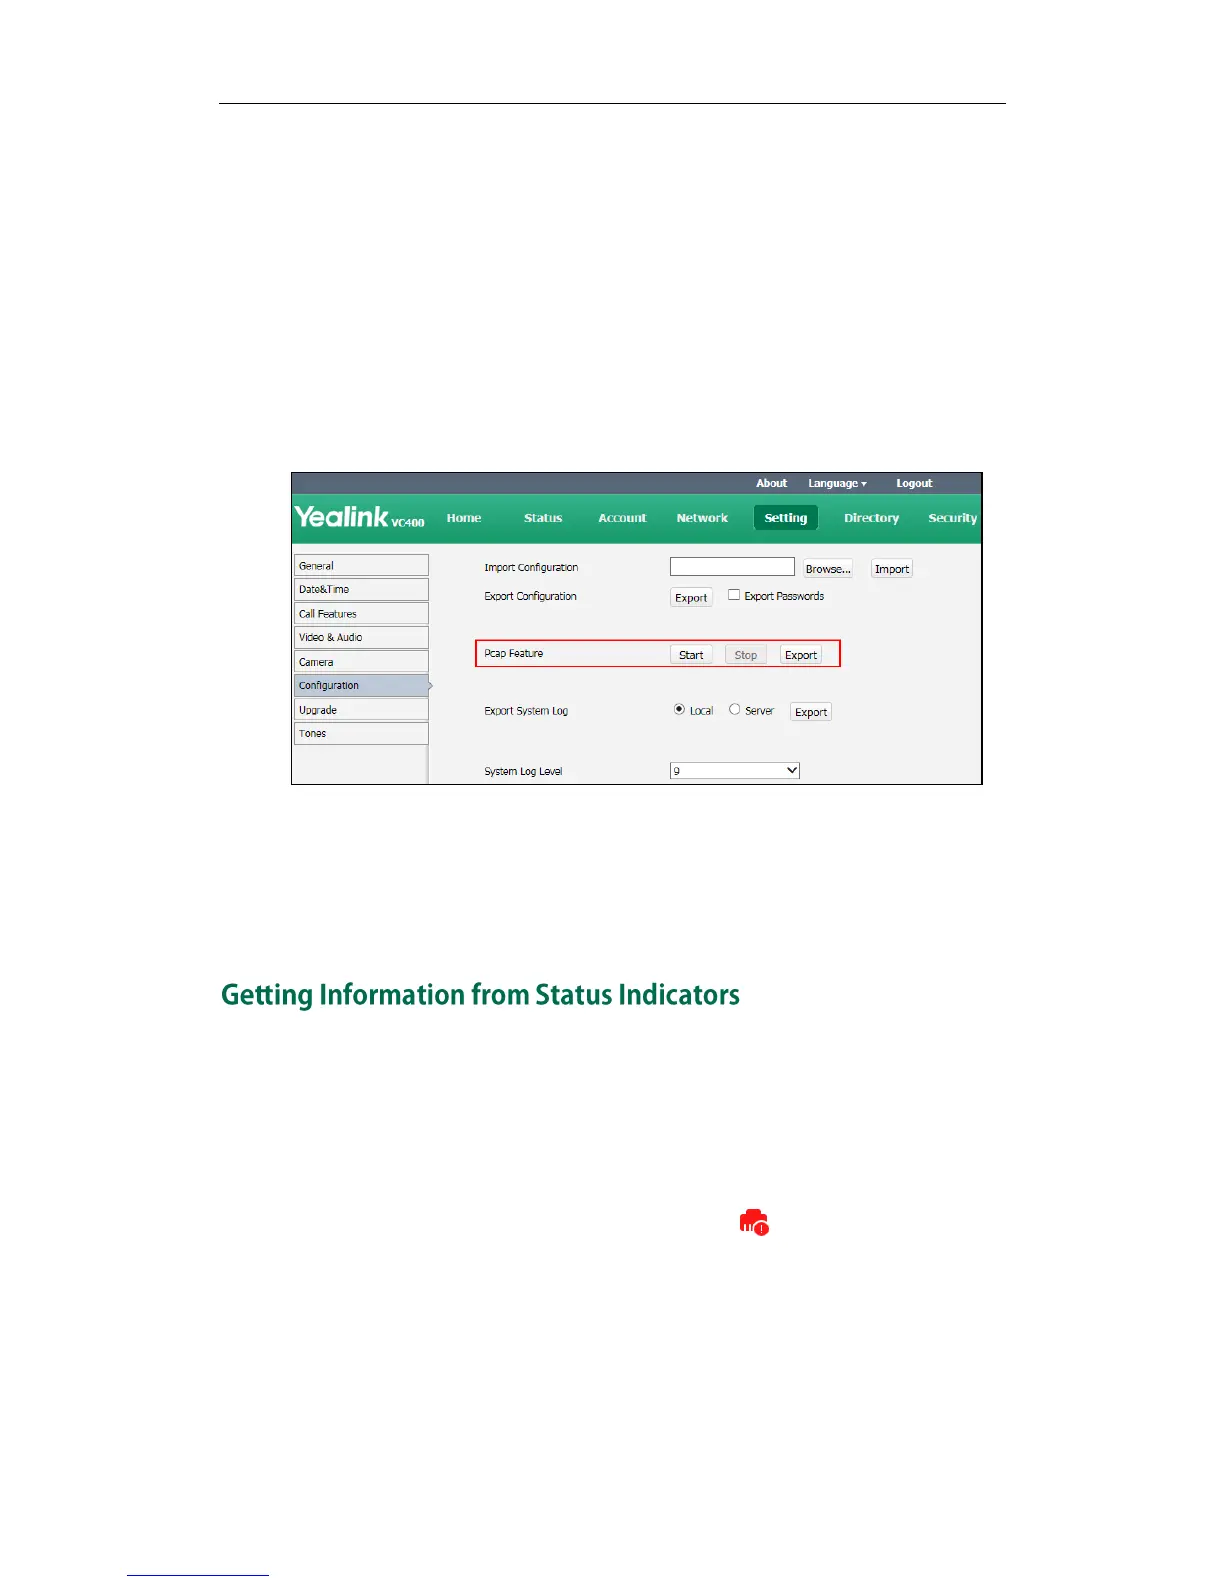
To capture packets via the web user interface:
1.
Click on Setting->Configuration.
2.
Click Start to start capturing signal traffic.
3.
Reproduce the issue to get stack traces.
4.
Click Stop to stop capturing.
5.
Click Export to open the file download window, and then save the file to your local
system.
To capture packets using the Ethernet software:
Connect the Internet ports of the system and the PC to the same HUB, and then use
Sniffer, Ethereal or Wireshark software to capture the signal traffic. You can also set
mirror port on a switch to monitor the port connected to the system.
In some instances, status indicators are helpful for finding system troubles. Status
indicators may consist of the power LED, icons on the status bar of the display device or
prompt messages.
The following shows two examples of obtaining the system information from status
indicators:
If a LINK failure of the system is detected, the icon will appear on the the status
bar of the display device, indicating the current network is not available.
If the power LED does not light, it indicates the system is not powered on.
For more information about the icons, refer to Icon Instructions on page 12.
 Loading...