Using Help | Contents | Index Back 386
Adobe Illustrator Help Using Graphs
Using Help | Contents | Index Back 386
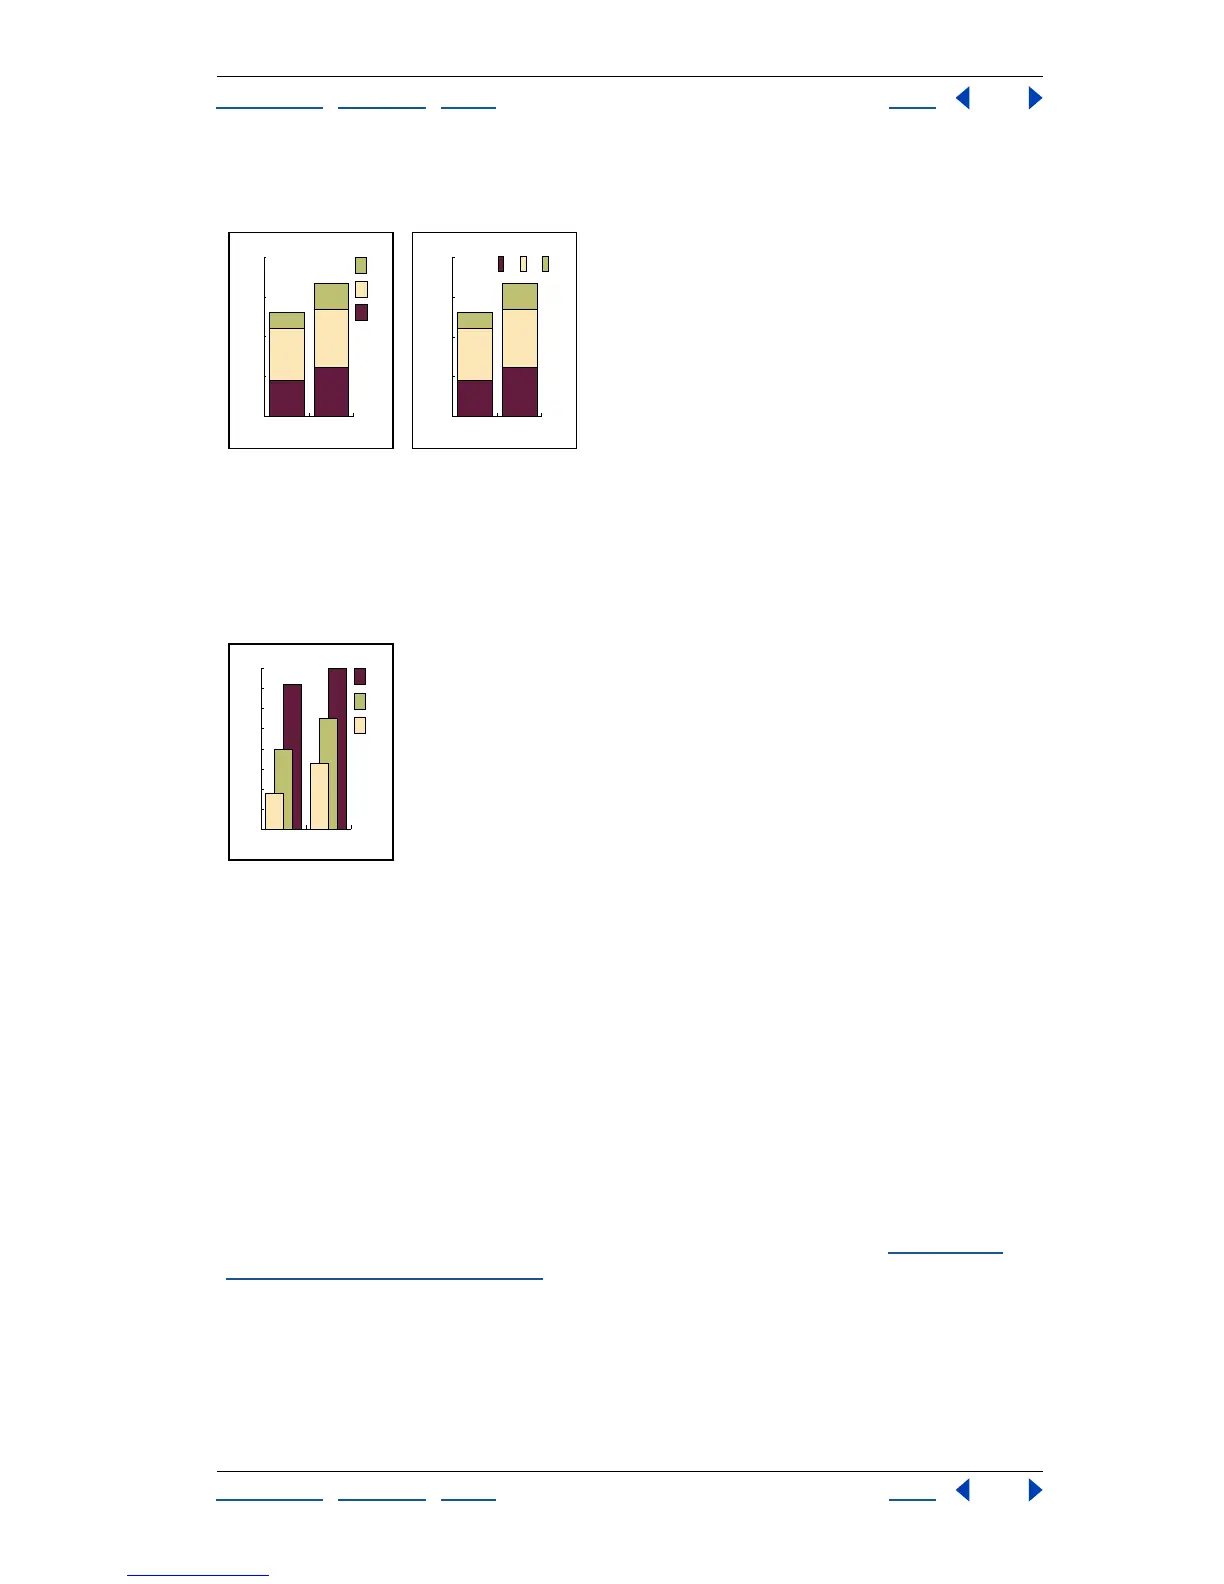
2 Click OK. By default, legends are displayed to the right of the graph. You can choose to
display them horizontally across the top of the graph.
Graph with default legends compared to graph with legends across top.
To make columns or bars of data overlap:
1 When creating a stacked column or stacked bar graph, in the Graph Type dialog box
enter a value in the Column Width or Bar Width text box greater than 100%.
2 Select First Column in Front, and click OK.
Graph with overlapping columns
To specify the order in which columns overlap:
1 In the Graph Type dialog box, to place the first row or column of data in the work sheet
frontmost in the graph, select First Row in Front or First Column in Front (the default). You
must always select this option for an area graph; if you do not, some areas may not appear.
2 Click OK.
Changing graph types
Once you create a graph, you can change to another graph type to illustrate the data more
effectively by using the Graph Type dialog box.
To change the graph type of an individual series of data, use the group-selection tool to
select the data series. Be sure to include the legend in the selection. (See “
Combining
different graph types” on page 387.)
Note: Once graph objects are painted with gradients, changing graph types can cause
unexpected results. To prevent undesirable results, either do not apply gradients until the
graph is finished, or use the direct-selection tool to select gradient-painted objects and
paint those objects with a process color; then reapply the original gradients.
0
50
100
150
200
CBA
19901980
0
50
100
150
200
C
B
A
19901980
0
10
20
30
40
50
60
70
80
C
B
A
19901980